This article provides an initial analysis of the financing of Basic Education in the Philippines. The principal trends in Basic Education spending, the structure of spending, and the utilization of resources are examined.
The article also summarizes the current state of Basic Education finance and identifies priority areas for further analysis to support the development of the BEDP.
Trends and patterns in spending have been operationalized as financial resources that have been obligated rather than final disbursement and payment.
During the period examined, the GoP has revised the budgetary framework and progressively rolled out Cash Based budgeting for the previous Obligation Based framework. Using obligations as a proxy for spending provides a basis for assessing trends and patterns over time.
Resources for Basic Education are provided from national-level resources and resources raised and managed by Local Government Units (LGUs) nationwide.
National resources are allocated to DepEd via the annual General Appropriations Act (GAA). The Department of Budget and Management (DBM) subsequently adjusts the final appropriation to conform with changes in the country’s macro-fiscal environment and based on previous years’ capacity to spend resources, and the resources are allotted to DepEd.
After the appropriation to DepEd, all resources for new construction in the budget for Basic Education are transferred to the DPWH for planning, execution, and reporting.
LGU resources for education come from funds appropriated from the national treasury (general fund) and a special taxing authority on real property – the Special Education Fund (SEF).
Table of Contents
The Evolution of Investment in Public Education
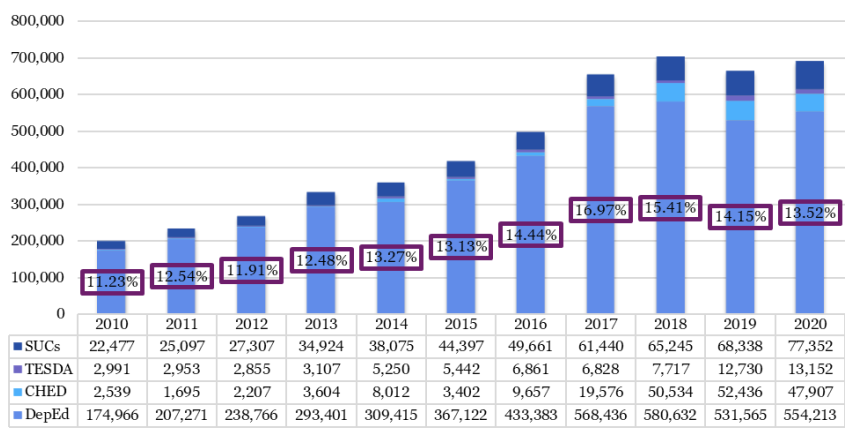
One means of assessing the level of commitment to education is to examine the trends in investment over time. Appropriations for the Education Sector increased consistently from 2010 to 2018 and as a percentage of central government appropriation from 2010 to 2016.
The composition of Education sector appropriations has evolved to reflect GoP priorities of increasing opportunities in skills development and postsecondary education, with relatively more outstanding shares of appropriated resources being allocated to Higher Education (CHED) and Vocational Technical Education (TESDA). During that same period, the appropriation for Basic Education fell from about 96 percent of central government appropriation in 2010 to 80 percent in 2020.
The share of Education Sector appropriation as a percentage of total government appropriations has for most years been below the recommended Education Framework 2020 Agenda benchmark of 15-20 percent.
Figure 1: Education Sector Appropriations FY 2010-2020
While the appropriation for Basic Education stagnated or decreased between 2017 and 2020, the allotment received by DepEd and spending (obligations) continued to increase during that same period51 – more than doubling between 2012 and 2020.
Figure 2: DepEd Allotment, Obligation and Disbursement, FY 2012-2019
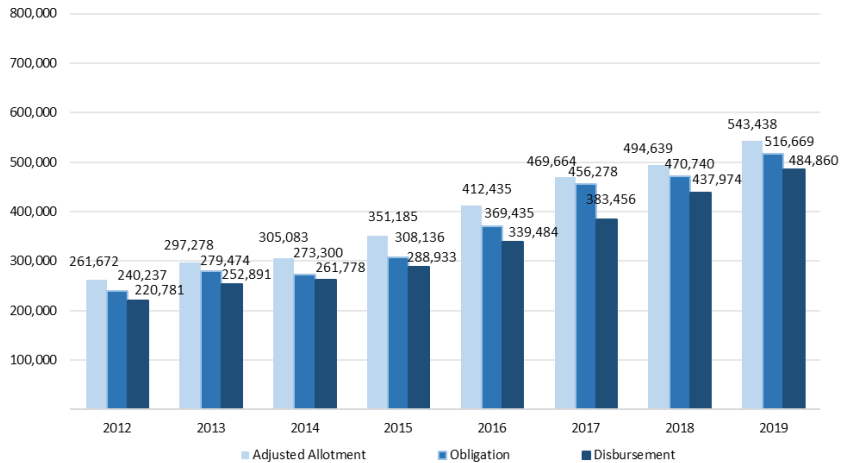
Table 1 presents total Basic Education spending from 2012-2017, incorporating the Basic Education Facilities Fund (BEFF-DPWH) and LGU spending. The table also presents total Basic Education spending as a percentage of GDP for each year.
As with the trend in DepEd spending, total Basic Education spending increased consistently between 2010 and 2017 in nominal terms and as measured as a percentage of GDP.
Table 1: Total Basic Education Spending, 2010-2017
| 2010 | 2011 | 2012 | 2013 | 2014 | 2015 | 2016 | 2017 | |
|---|---|---|---|---|---|---|---|---|
| National Government | 191,118 | 218,817 | 240,238 | 291,030 | 284,606 | 365,202 | 430,048 | 577,924 |
| Local Government | 13,526 | 14,435 | 16,232 | 16,654 | 15,976 | 15,984 | 16,468 | 18,889 |
| Total Government | 204,644 | 233,252 | 256,470 | 307,684 | 300,582 | 381,186 | 446,516 | 596,813 |
| As % of GDP | 2.2% | 2.3% | 2.3% | 2.6% | 2.3% | 2.7% | 3.0% | 3.6% |
DepEd-managed spending represented about 77 percent of Basic Education spending in 2017 – down from about 90 percent in 2013.
BEFF spending as a share of all Basic Education spending has increased from about 3 percent in 2013 to 20 percent in 2017. While LGU spending increased most years in nominal terms, DepEd and BEFF spending has increased faster, and the share of total Basic Education spending financed by LGUs has decreased from about 6 percent in 2010 to about 3 percent in 2017.
The national revenue projections for 2021 have been significantly impacted by the measures to address the consequences of the COVID-19 public health emergency. Initial information indicates that the appropriation for DepEd may be some Php 13 billion lower than the 2020 appropriation. The planned reductions have been concentrated on infrastructure projects and another capital spending.
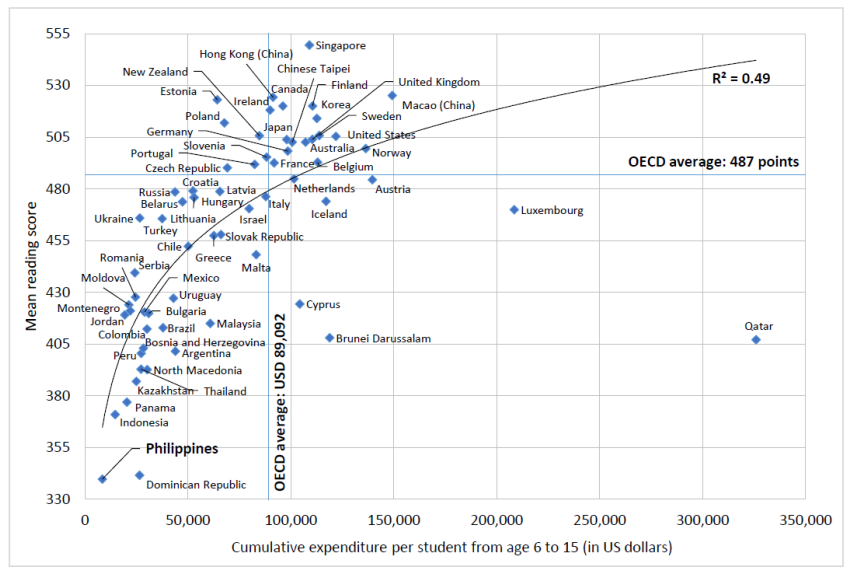
International comparisons have demonstrated a clear relationship between government commitment, spending, and results. Analysis of the PISA spending and reading scores data highlights the challenges for the Philippine system in mobilizing sufficient resources to improve outcomes consistent with other countries of similar income levels.
Figure 3: Cumulative Spending per Student and Learning Outcomes from PISA
In addition to assessing the adequacy of education investment for meeting policy goals in the Philippines, it will also be necessary to review the efficiency of education spending by examining the relationship between levels/types of spending and outcomes and how those relationships may differ by region of the country.
The Structure of Education Spending
An important aspect of the efficiency of education spending in delivering outcomes for the people of the Philippines is the coherence or alignment between education spending and education policies and priorities the government identifies.
Examining how public spending is allocated to different programs within Basic Education facilitates an assessment of the coherence between spending and policy priorities.
A major recent policy initiative was incorporating two additional years of secondary education into publicly supported Basic Education in 2016.
Figure 4 presents spending for the Operation of Schools for both kindergarten/elementary and secondary education (JHS and SHS) from 2015 to 2019.
Figure 4: Trends in Education Spending by Level
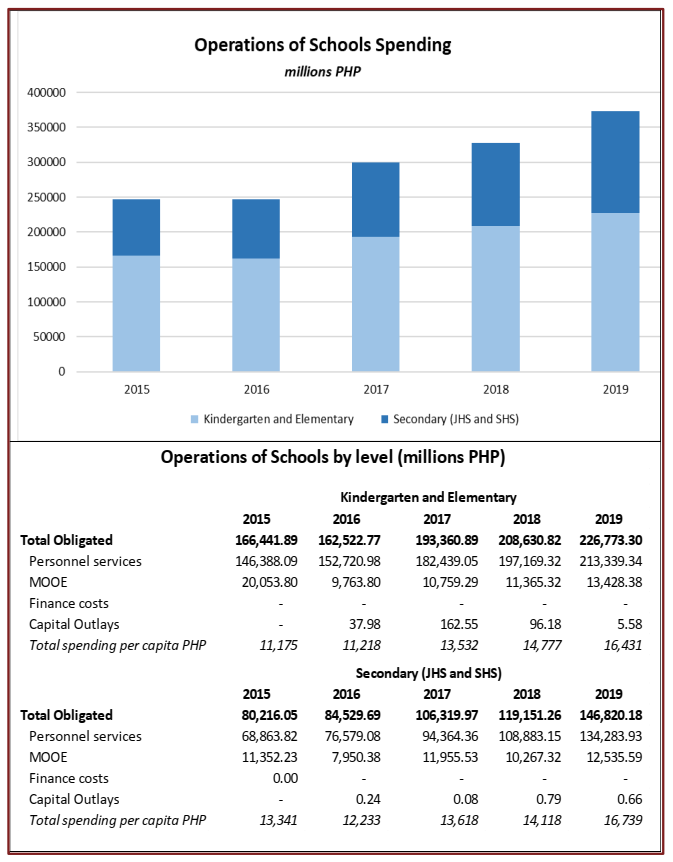
The relative growth in spending for secondary relative to elementary education56 is consistent with the expansion of publicly supported secondary education years.
Spending for Operations of Schools per student for the two levels since 2017 differs by less than one thousand pesos. With similar per capita expenditures for the levels, the increase in spending for the expansion of publicly supported secondary education is almost entirely explained by increasing numbers of students rather than any differences in costs between providing a year of secondary education and a year of elementary education.
The idea that the budgetary impact of providing a year of elementary and secondary have nearly identical costs is not consistent with the differences in pedagogical requirements for the two levels with respect to the level and specialization of the teachers, infrastructure requirements for specialized rooms like laboratories and the costs of learning materials.
Estimating the budgetary impact of possible BEDP initiatives to increase participation in secondary education will require developing more econometrically sound and comprehensive estimates of the relative unit costs for the various levels of the system. The estimates include the differences in teacher, infrastructure, and program development costs for the various levels of the system, as well as regional differences.
The need for more concise estimates of unit costs also applies to the priorities of EduKalidad; K to 12 curriculum review, improving the learning environment, upskilling/reskilling of teachers, and enhanced stakeholder engagement.
Each pillar of the program implies changes to the current pattern of resource allocation in the DepEd and broader Basic Education budget. Sound estimates of these implications must feature in the BEDP.
The Government of the Philippines also provides public investment in secondary education through subsidies to students to attend private institutions, Education Service Contracting (ESC) for JHS students, and Vouchers for SHS.
Table 2: ESC and Senior Secondary Voucher Program Spending
| ESC | Voucher Program (SHS) | |||
|---|---|---|---|---|
| # | PHP (M) | # | PHP (M) | |
| 2016 | 937,694 | 7567.25 | 645,899 | 10743.68 |
| 2017 | 978,222 | 8328.75 | 1,277,688 | 21320.66 |
| 2018 | 1,048,193 | 9668.03 | 1,328,950 | 22913.12 |
| 2019 | 1,082,632 | 10210.81 | 1,295,229 | 22457.22 |
Spending for ESC contracts in 2019 was Php 10,210.81 million in 2019, and for the SHS Voucher programs was Php 22,457.22 million.
The number of voucher program students has grown much faster than the ESC contracts reflecting the incorporation of additional years of SHS into publicly supported Basic Education.
The spending per participant for ESCs increased from about Php 8,000 in 2016 to a little more than Php 9,400 in 2019, while the average voucher increased from about 16,000 to just more than Php 17,300.
The rationale for public investment in the ESC and Voucher programs was to expand Junior and Senior High School by leveraging existing private sector investment.
For both programs, the contracts or vouchers were intended to provide additional school places at a cost lower than the cost of expanding the public system.
This aspect of both programs was formally assessed; in 2011 for ESC and 2018 for the voucher program. Both studies found the contract and voucher amounts at the time of the study to represent cost savings to DepEd compared to expanding the number of public sector places.
However, both studies raised questions concerning subsidies going to relatively better-off students who could afford to pay school fees. Subsidizing students who would likely attend without subsidies reduces the efficiency of the programs in expanding access to secondary education.
The 2018 assessment of SHS costs also highlighted that differences in land prices created very different cost structures for private providers in different markets and areas of higher land prices. Current Voucher amounts were likely too low to incentivize private schools to take additional voucher-paying students or that the top-up fees required would subsidize students who already have the financial capacity to attend Senior Secondary school.
Finally, Basic Education spending was analyzed concerning the distribution of spending across the three program areas; General Administration, Support to Operations, and Operations of Schools (Figure 5).
Figure 5: Spending by Program/Object
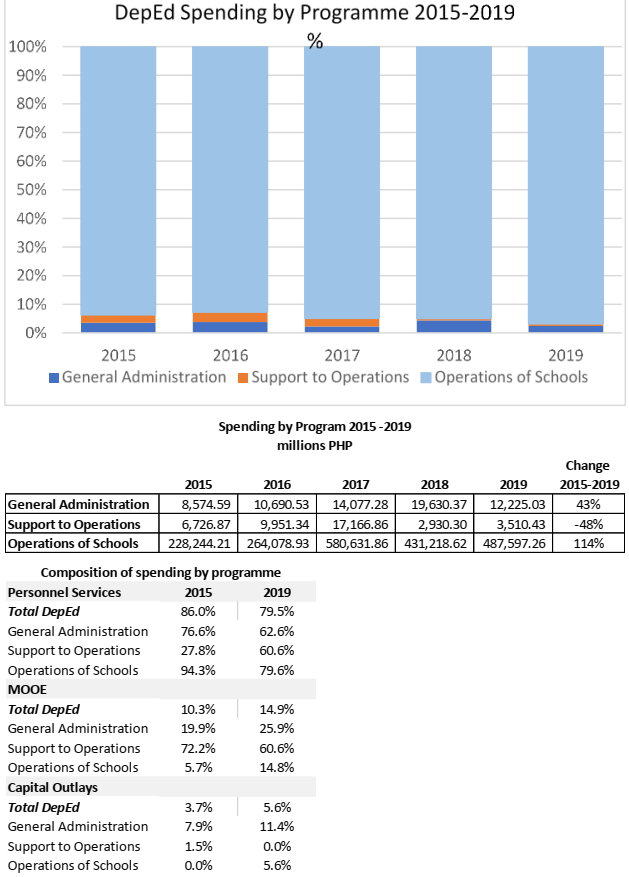
Operations of Schools is the largest spending program within the DepEd budget. Spending on Operations of Schools doubled (114 percent increase) between 2015 and 2019. Some of the increasing “weight” of school operations spending likely reflects some economies of scale – with growth in enrollment having a greater impact on school-level resource requirements than administrative or program development resource needs.
Staff costs (Personnel Services) represent about 80 percent of total DepEd spending in 2019 – down from about 86 percent in 2015. Not surprisingly, spending on Personnel Services is by far the largest for Operations of Schools at more than 94 percent of spending in 2015.
By 2019 relatively more spending for Operations of Schools was for MOOE (nearly 15 percent compared to 6 percent in 2015), and spending for Personnel Services had fallen to 80 percent of Operations of Schools spending.
This shift in spending is consistent with the expansion in resources made available for school-level education quality investments. There is a consensus that the MOOE resources are inadequate to meet school operational needs.
In some localities, this shortfall is at least partially addressed by LGU resources. However, the capacity of LGUs to provide additional resources can vary significantly depending on their ability to generate revenues. In order to ensure a more equitable allocation of operational resources (MOOE) to schools, it may be necessary to explore alternative formulas for allocation that incorporate LGU’s financial capacity.
DepEd reported that capital spending is difficult to assess as the primary mechanism for expansion and major renovation of facilities is implemented through the BEFF managed by the DPWH.
In the latest available data, BEFF funding managed by DPWH represented about 20 percent of total Basic Education spending. For BEDP development, a more detailed and timely analysis of BEFF and LGU spending will be required.
Budget Utilization
Meeting GoP education policy goals and priorities depends on efficiently translating the financial resources into the required human, material, and capital investments.
Assessing budget utilization in Basic Education is complicated because three entities manage the spending of public resources: DepEd, DPWH, and LGUs.
Historically, the greatest challenges in utilizing resources allocated to Basic Education are in developing and managing infrastructure projects.
The demands of annual accounting/liquidation required in Cash Based Budgeting and the multi-year timeline required to design, permit, procure and execute infrastructure projects have created significant challenges. Several strategies have been proposed to improve the planning and implementation of infrastructure projects.
A complete analysis of these alternatives will be undertaken in the BEDP development process. Similarly, LGU spending and budget utilization are not well analyzed in existing documentation, and additional primary data on LGU spending and budget utilization will need to inform BEDP options and adequately develop cost estimates.
The Bureau of Local Government Finance reports that LGU utilization rates of the revenues generated from the tax on real property (Special Education Fund) have averaged about 68 percent in the most recent years available -with rates varying by region between 48 percent and 75 percent.
The Bureau identifies the limits on expenditure categories as one of the primary constraints on higher utilization levels. Additional analysis of detailed LGU spending and budget utilization will need to be undertaken to inform BEDP options and adequately develop cost estimates.
While assessing budget utilization limited to DepEd managed resources is more straightforward, a single indicator for the Department may not provide clear guidance. As summarized previously, about 80 percent of DepEd budget resources are for Personnel Services. Salaries and other compensation like contributions to pensions are predictable and are easily liquidated once established through transfers to recipients’ bank accounts.
MOOE spending typically pays invoices for supplies and materials, transportation and travel costs and allowances, utilities, repairs, and small capital projects.
The administrative burden for obligating and disbursing payments is significantly higher than Personnel Services spending. Capital Outlays represent an even higher administrative burden as they are typically more costly and (depending on the established thresholds) subject to higher levels and more time-consuming scrutiny to comply with public sector procurement practices.
The recent adoption and staged rollout of the Cash Based Budgeting framework and the changing windows for liquidation for different types of spending are added to the complexity of characterizing budget utilization.
Figure 6 plots Economic Object’s obligation and disbursement rates from 2015-2019. The calculations were undertaken to utilize SAA ODBs for 2015-2019 provided by DepEd.
Figure 6: DepEd Budget Utilization 2015-2019
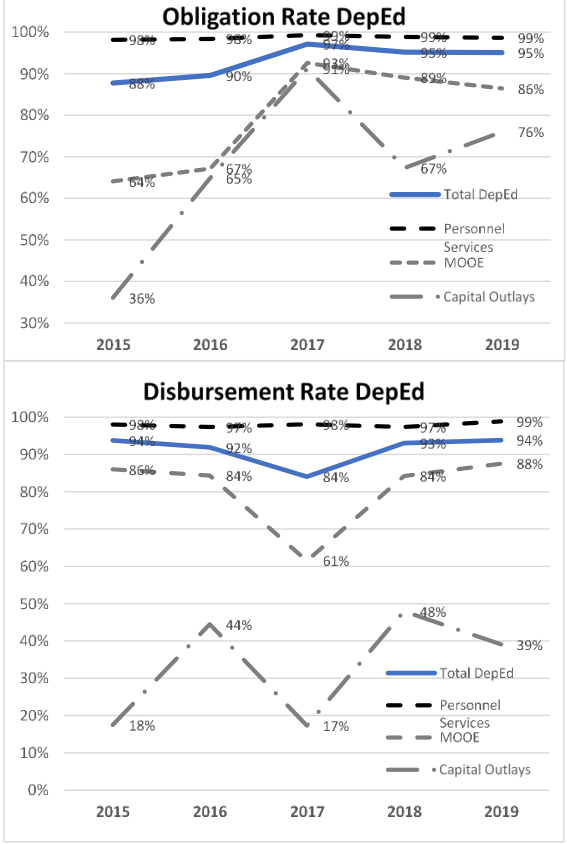
The obligation rate represents the percentage of the adjusted allotment received by DepEd that was obligated by 31 December of the FY. The disbursement rates were calculated as the percentage of the funds obligated during the FY that were paid by the final FY report was generated.
Overall, the DepEd obligation rate department-wide improved from about 88 percent in 2015 to 95 percent in 2019. As expected, the obligation and disbursement rates for Personnel Services are nearly 100 percent each year.
The obligation rate for MOOE spending also improved considerably over the period. However, disbursement rates indicate that for some types of MOOE expenditures, there remain challenges in executing planned spending. These will need to be examined in more detail in the BEDP development process.
Major capital expenditure programs for facilities are managed by DPWH rather than DepEd. The capital outlays managed by DepEd are primarily learning tools and equipment and ICT for schools and the Department.
The obligation rate for Capital Outlays improved over time but still represents a significant challenge and warrants a more detailed analysis in the development of the BEDP.
A final factor impacting DepEd’s utilization of financial resources is the lack of a comprehensive financial management information system.
Accounting for expenditures within the Department relies on a series of ad hoc practices and systems developed over the years – consuming enormous quantities of staff time.
A module enabling DepEd to access and manage transactions directly in the Government Financial Management Information Systems (GFMIS) is being piloted. DepEd is developing its automated system to facilitate expenditure reporting and management at the Region, SDO, and school levels.
Household Spending in Education
Households are an essential source of education spending in the Philippines. Using data from the 2018 Family Income and Expenditure Survey, it is estimated that spending on education represents about 2.6 percent of total annual expenditures for the average household in the Philippines.
Poorer households spend a smaller percentage of their annual expenditures on education than wealthier households. When total expenditures are considered, the differences in nominal spending for education between poorer and wealthier households are pretty significant.
For example, the average percentage of total annual expenditures dedicated to education for the poorest 30 percent of households was 1.5 percent in 2018, while the percentage for the other 70 percent was 2.8 percent.
When converted to annual spending on education using the average total household expenditures for both groups, households in the bottom 30 percent had education expenditures only about 1/10th of those of less poor (upper 70 percent) households.
A complete examination of the demographic and social factors associated with differences in household spending on education and a better understanding of the composition of education spending will be needed to support the development of a BEDP that promotes equity in the provision of educational resources.
Development Partner Support to Basic Education
DepEd recognizes the need to coordinate and maximize all development partners to achieve its tripartite access, quality, and governance goals.
The broad areas of international development assistance are summarized in the table below. These organizations also coordinate among themselves to ensure effective and efficient support for DepEd.
Table 3: Summary of Selected Foreign-Assisted Projects
| Agency | Focus Areas | Estimated investment in 2010-2019 | Areas Covered |
|---|---|---|---|
| Asian Development Bank | Senior High School | US$300 million Loan | Nationwide |
| Secondary School | US$300 million Loan | Nationwide | |
| Assistance in Marawi | US$1 million Grant | ||
| Australia DFAT | Institutional Capacity Support | AUS$9.1 million Grant | |
| Research and Evaluation | AUS$3 million Grant | Regions V, VI, VIII and X | |
| Institutional Capacity Support | AUS$90 million Grant | BARMM | |
| KOICA | Alternative Learning System | US$6 million | Region VIII |
| Korea Exim Bank | School Construction | US$386.6 million Loan | Region III |
| UNICEF | Quality Inclusive Lifelong Learning | US$29.4 million Grant | |
| USAID | K to 3 Special Education | US$1.4 million Grant | |
| K to 3 Literacy and Numeracy | US$38.5 million Grant | Regions V, VI and BARMM | |
| Out of School Youth | US$37.5 million Grant | Selected cities nationwide | |
| Support for the PQF | TBD | ||
| Education Governance | US$8.6 million Grant | ||
| World Bank | K to 3 Literacy and Numeracy | US$300 million Loan | |
| School Leadership, Teacher Coaching, and Peer Learning | US$100 million Loan | Regions IX, XII and BARMM | |
| Pilot for Teacher Coaching, with a focus on Literacy and Peace Education | US$0.4 million Grant |
READ:
Share of Private Schools Enrollment in Basic Education in the Philippines
Language as a Key Element of Quality of Learning
Importance of Time in School Assigned to Teaching and Learning
Teacher Quality as a Key Factor Influencing Student Learning Outcomes
Curriculum Issues Affecting Student Learning Outcomes in the Philippines
Reading Performance Declining in the Philippines
Transition Issues Between Learning Stages in the Philippines
Overview of Student Learning Outcome Assessments in the Philippines
Bullying and School-Related Gender-Based Violence in the Philippines
Overview of the Structure of the Education System in the Philippines
Source:
Office of the Undersecretary for Administration (OUA)