Clear policy guidelines on the national assessment of student learning for the K to12 Basic Education program were issued in 2016. This policy document defines assessment as “the process of measuring learners’ progress in the attainment of learning standards and 21st-century skills”. The results of the various assessment forms shall be used to quantify judgment on learners’ academic performance.
The table below lists all national and international large-scale assessments conducted through the Bureau of Education Assessment (BEA) and the grade levels at which they are measured. Each test is discussed in greater detail in this article.
Table of Contents
Measures of Student Learning Outcomes for Basic Education
Table 1: Measures of Student Learning Outcomes for Basic Education
| K | 1 | 2 | 3 | 4 | 5 | 6 | 7 | 8 | 9 | 10 | 11 | 12 | |
|---|---|---|---|---|---|---|---|---|---|---|---|---|---|
| School Readiness (SREA) | X | ||||||||||||
| Early Language, Literacy and Numeracy Assessment (ELLNA) | X | ||||||||||||
| Trends in International Mathematics & Science Study (TIMMS) | X | ||||||||||||
| Southeast Asia Primary Learning Metrics (SEA-PLM) | X | ||||||||||||
| National Achievement Tests (NAT) Grade 6 | X | ||||||||||||
| Career Assessment | X | ||||||||||||
| Accreditation & Equivalency Assessment (A&E) for Alternative Learning System | X | X | |||||||||||
| National Achievement Tests (NAT) Grade 10 | X | ||||||||||||
| Program for International Student Assessment (PISA) -15-year-old student) | X | X | X | ||||||||||
| Basic Education Grade 12 Exit Assessment | X |
Kindergarten
Smoothing the transition from home to school by establishing individual learners’ starting points is a critical assessment element for early childhood educators. Admission to Kindergarten requires that the Philippine Early Childhood Development (ECD) Checklist is administered to the learner before the start of the opening of the school year to ensure the learner’s readiness to meet the curriculum’s expectations at the Kindergarten level.
Parents may also provide documentation of the learner’s previous Early Childhood Education (ECE) experiences (at preschool, daycare, and pre-Kindergarten) in addition to the results of the Philippine ECD Checklist.
At the end of the Kindergarten year, a School Readiness Assessment Test (SREA) is conducted using the pupils’ mother tongue or the language spoken at home to gauge their readiness for admission to Grade 1.
The assessment result is a critical input for the Grade 1 teachers because they will be provided with a child’s readiness profile which is crucial in addressing a pupil’s specific learning need.
However, the assessment is not considered an achievement test or final examination, and no child of the right entry-age is refused entry to Grade 1 based on the results of this assessment.
Elementary Education
There are three separate assessments administered during Grades 1 to 6:
Early Language, Literacy and Numeracy Assessment (ELLNA)
ELLNA is administered to students at the beginning of Grade 4 as a key stage assessment of the early childhood stage of Grades 1 to 3 to determine if students are meeting the learning standards in early language, literacy and numeracy.
The test is administered during October of each school year to Grade 4 students in a sample of schools representing a cross-section of schools within each division.
Figure 1: ELLNA Mean Raw Scores (By Gender) 2017-2018
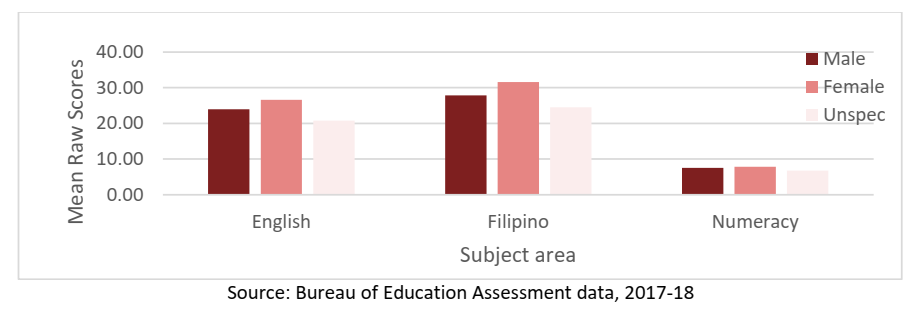
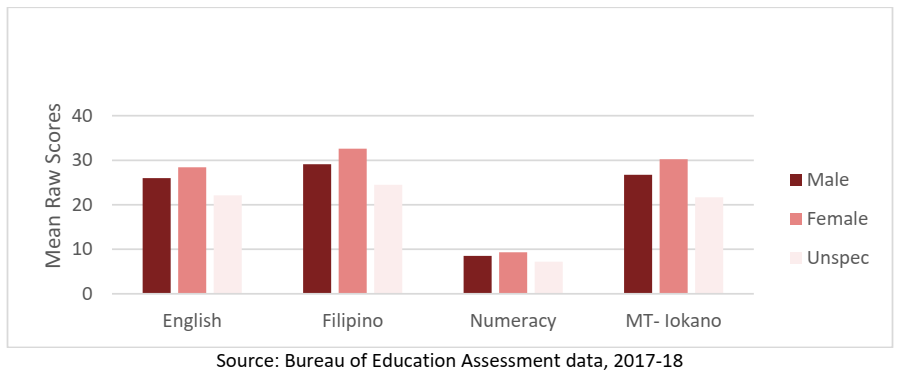
The test is also administered in each of the 19 separate mother-tongue (MT) languages, and the results are recorded for each. The full data across all MT languages are not reported here – figure 1 shows the mean scores for one mother tongue group (Ilokano) chosen to illustrate an example of the MT data.
Figure 2: ELLNA Mean Raw Scores for One Mother Tongue Group (Ilokano) 2017-2018
These data show that overall, females perform better than males across all subjects, although the unspecified gender group makes this conclusion uncertain.
For MT data, there is no significant difference between the mean scores in the national language (Filipino) and the mother-tongue responses. This holds across all other 18 mother tongue examples.
However, it is apparent from research reported by SEAMEO-Innotech that there are large within-region variations in language proficiency throughout all parts of the Philippines and across many MTs, so this regional disparity needs to be carefully considered.
Trends in International Mathematics & Science Study (TIMMS)
TIMMS is a large-scale international assessment (ILSA) program usually administered to a broad sample of Grade 4 and Grade 8 students in mathematics and science, but for TIMMS 2019, the participation was in Grade 4 only.
A complete analysis of the Philippines Country Report for TIMMS 2019 is not yet available, but some results can be drawn from the international summary released in January 2020.
The TIMSS 2019 Mathematics Framework and the Science Framework were each organized around two dimensions: a content dimension specifying the content to be assessed and a cognitive dimension specifying the thinking processes to be assessed.
Mathematics in the fourth grade assessed three content domains: number, measurement and geometry, and data. The fourth-grade assessment assessed three content domains: life science, physical science, and earth science.
Both subjects also assessed three cognitive domains: knowing, applying, and reasoning, using approximately 175 items for each mathematics and science to ensure broad coverage of each area.
Mathematics Achievement in Grade 4
The Philippines had previously participated in TIMSS Grade 4 in 2003, where the Philippines had ranked 23rd out of 25 countries for Grade 4 Mathematics and Science that year.
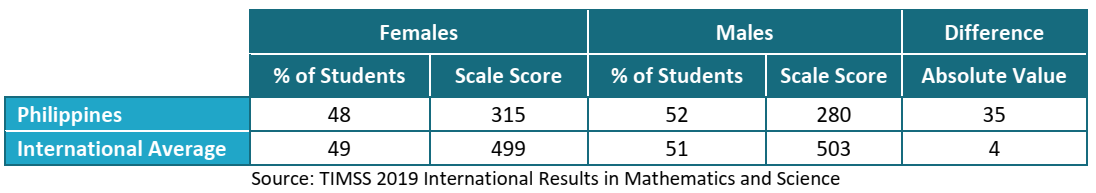
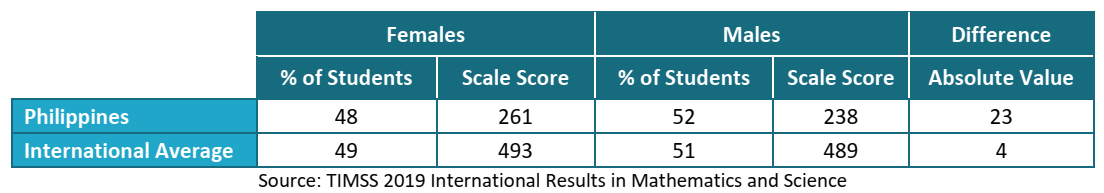
For TIMMS 2019, in the measurement of average mathematics achievement, the center point average of the scaled data was 500. The Philippines scored 297 and was ranked 64th out of 64 countries participating in the assessment.
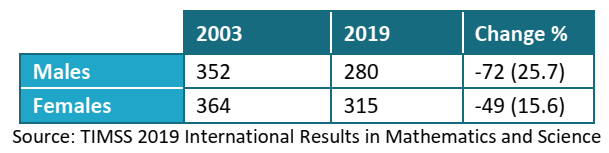
This represents a major decrease in performance since the last TIMMS assessment in 2003, where the average score was 358.
When gender was considered, only four countries had females with a higher average achievement than males, and the Philippines had the largest difference between genders of all countries measured.
Table 2: Average Mathematics Achievement, by Gender
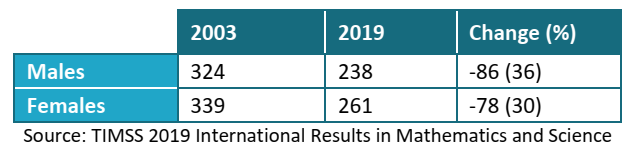
When the trend in achievement in mathematics in the period between 2003 and 2019 is considered, there was a significant decrease in the achievement levels of both males and females. However, male performance dropped by a factor of 10% more than that of the females.
Table 3: Changes in Average Mathematics Achievement (by Gender)- 2003 to 2019
Science Achievement in Grade 4
The Philippines had previously participated in TIMSS Grade 4 in 2003, where the Philippines had ranked 23rd out of 25 countries for Grade 4 Mathematics and Science that year.
For TIMMS 2019, in the measurement of average science achievement, the center point average of the scaled data was 500. The Philippines scored 249 and was ranked 64th out of 64 countries participating in the assessment. This also represents a significant decrease in performance since the last TIMMS assessment in 2003, where the average score was 322.
When gender was considered, females had higher average achievement than males.
Table 4: Average Science Achievement (by Gender)
When the trend in achievement in science in the period between 2003 and 2019 is considered, there was a significant decrease in the achievement levels of both males and females. However, male performance dropped by a factor of 6% more than that of the females.
Table 5: Changes in Average Science Achievement (by Gender)- 2003 to 2019
The international data for TIMMS reported differences in average achievement between females and males in the three science content domains (Life Science, Physical Science, and Earth Science). The differences differed from content domain to content domain.
Unfortunately, comparable data were unavailable for the Philippines because average achievement could not be accurately estimated.
The consolidated international data showed that females had higher average achievement in life science than males in all countries; in physical science, females had higher average achievement than males in 4 countries, and boys had higher average achievement in 13 countries.
In Earth science, girls had higher average achievement than boys in 4 countries, and boys had higher average achievement in 16 countries. Students in the Philippines likely show low performance in Earth science because it is not part of the science curriculum in Grade 4.
Southeast Asia Primary Learning Metrics (SEA-PLM)
SEA-PLM was conducted in 2019 with six participating countries, as shown in Table 23. It is noteworthy that the Philippines was the only country that used English as the test language instead of the national language (Filipino). All other countries used their national languages as the test language.
Table 6: SEA-PLM 2019 Language(s) In Participating Countries
| Country | Language |
|---|---|
| Cambodia | Khmer |
| Lao PDR | Lao Language |
| Malaysia | Chinese, Malay, Tamil |
| Myanmar | Myanmar Language |
| Philippines | English |
| Vietnam | Vietnamese |
The assessment sought to determine what Grade 5 children know and can do in reading, writing, and mathematics, as well as their attitudes, values, and behaviors towards global citizenship.
The research also administered background questionnaires to collect additional information about classrooms, schools, teachers, head teachers, parents, and communities.
The results were categorized using a 6-band rubric, with Band 6 being the highest performance; the lowest responses were considered as Band 3 or below.
Across participating countries, 1 out of 3 children in Grade 5 is performing at the level of expectations for the early years of elementary education.
However, there were wide divergencies, and the study found that only 2% to 50% of children can read and write simple words and do basic mathematics across the six participating countries.
For the Philippines reading, a small percentage of Grade 5 children in the Philippines had achieved Band 6 and above or were progressing (Band 5) towards achieving the expected levels of reading proficiency at the end of primary education.
For writing, most students across all 6 SEA-PLM 2019 countries do not demonstrate writing proficiencies expected of a Grade 5 student. In the Philippines, more than 70% of Grade 5 children were in the three lowest bands. However, even the highest performers of this group can produce minimal writing, with simple, insufficient ideas and limited vocabulary.
For mathematics, a modest percentage of Grade 5 Filipino children have achieved the mathematical literacy skills expected at the end of primary school (Band 6). This implies that most Grade 5 children are still working towards mastering fundamental mathematical skills; students had great difficulty writing an answer (constructed response) compared to needing to select an answer from given options (multiple choice). Students appeared to be more familiar with undertaking calculations than with formulating, interpreting, communicating, and explaining a solution.
The findings on global citizenship deserve special attention. For instance, children and teachers indicate significant interest in and concern about environmental issues, including climate change. Solving disagreements with classmates and solving problems in the community appeared to be among the most valued lessons learned at schools. At the same time, less than half of the children reported experience speaking in an organized debate or discussing global problems. Encouraging findings emerge from the report as well. Data found that in all countries, children who had attended at least one year of preschool education consistently performed better than children who had not.
Differences between gender groups were again noted, with females significantly more likely to have higher levels of achievement in both reading and writing and mathematical literacy. This pattern was evident in all SEA-PLM 2019 countries. Further statistical analysis of the data showed that gender was a significant and consistent predictor of performance for mathematics in the Philippines, even when socioeconomic context and school location were equalized between students.
National Assessment Test (NAT) for Grade 6
NAT for Grade 6 is seen as an “exit assessment” to determine if students are meeting the learning standards of elementary education (Grades 1-6).
The NAT 2017-18 and NAT 2018-19 test results are not comparable to the previous NAT tests because of the introduction of 21st-century skills into the tests across the core subjects and the changed analysis based on proficiency levels.
Unfortunately, results for SY 2018-19 are unavailable due to a logistics problem in BEA; results for SY 2019-20 are also unavailable because the banning of face-to-face interaction brought about by COVID-19 meant that NAT testing is usually conducted at the end of the school year was not possible.
For the NAT test scores, the following assessment scale is used:
Table 7: NAT Assessment Scale
| Levels of Proficiency | Mean Percentage Score |
|---|---|
| Highly Proficient | 90 – 100 |
| Proficient | 75 – 89 |
| Nearly Proficient | 50 – 74 |
| Low Proficiency | 25 – 49 |
| Nor Proficient | 0 – 24 |
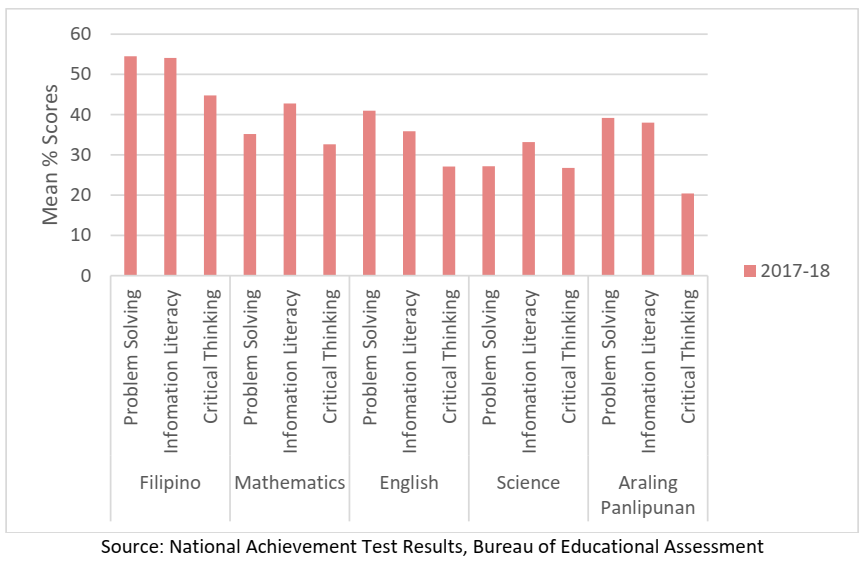
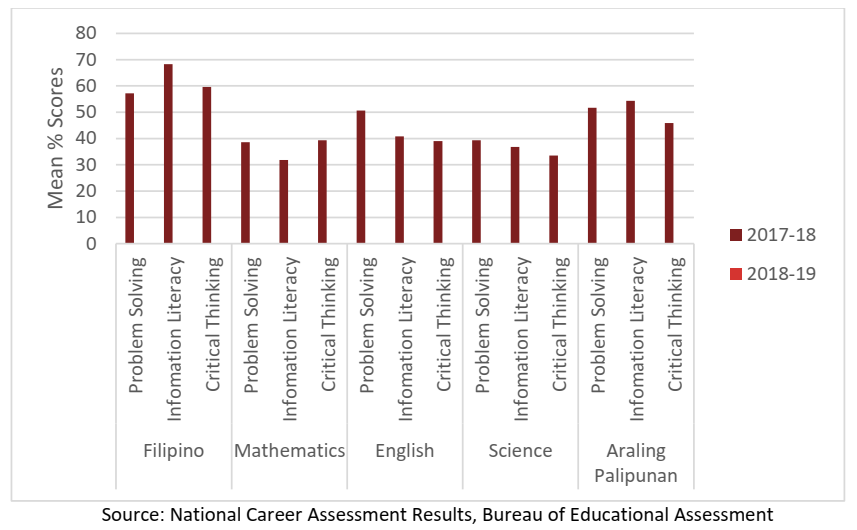
Summary national data at Grade 6 level for SY 2017-18 for the three 21st-Century Skills of Problem Solving, Information Literacy and Critical Thinking and the five subjects of Filipino, Mathematics, English, Science, and Araling Panlipunan are shown in Figure 3.
With only one year of testing using the changed test, it is impossible to discern trends across two or more tests. However, it is clear that students perform better in Filipino than in all other subjects, and it is the only subject where the mean percentages approach “nearly proficient.”
Figure 3: NAT Grade 6 Proficiency Levels, SY 2017-2018
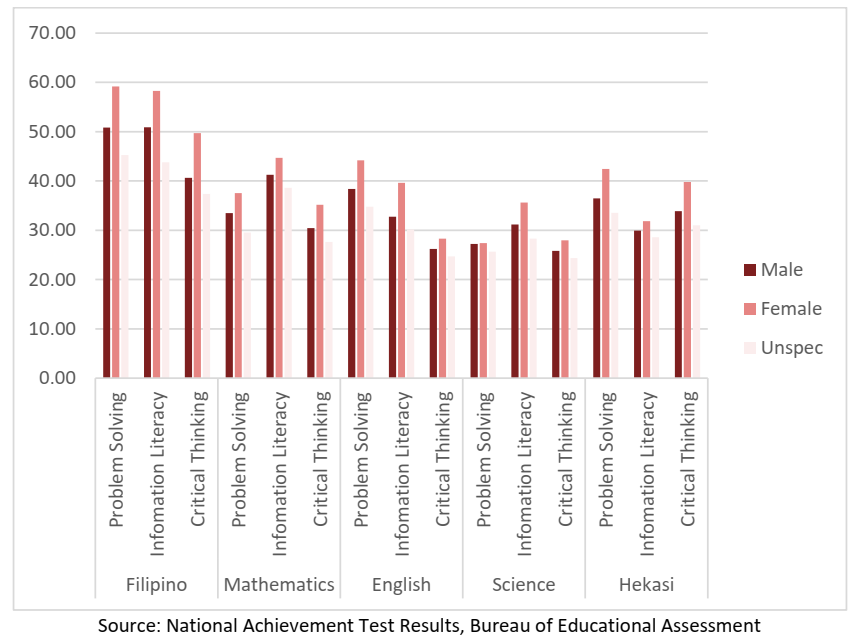
Similar national gender-disaggregated data is shown for SY 2017-18 (Figure 4). Female students outperformed male students across all areas in Grade 6 testing.
Figure 4: NAT Grade 6 Proficiency Levels, by Gender, SY 2017-2018
National proficiency levels for the four subject content areas of Filipino, Mathematics, English, Science, and Araling Panlipunan are shown in Figure 5.
Figure 5: Mean Proficiency Scores by Subject, NAT Grade 6, SY 2017-2018
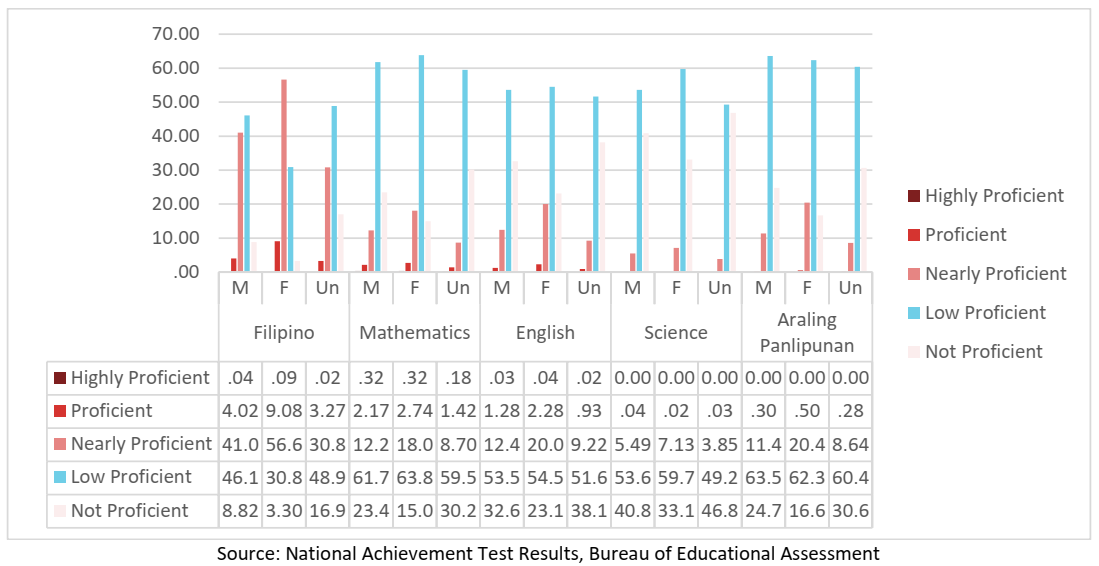
The data reveals that students are not reaching proficiency in any subjects, and only female students are nearly proficient in Filipino. Females are performing better on average than males across all subjects.
Figure 6: NAT Grade 6 Mean Percentage Score, by gender and location, SY 2017-2018
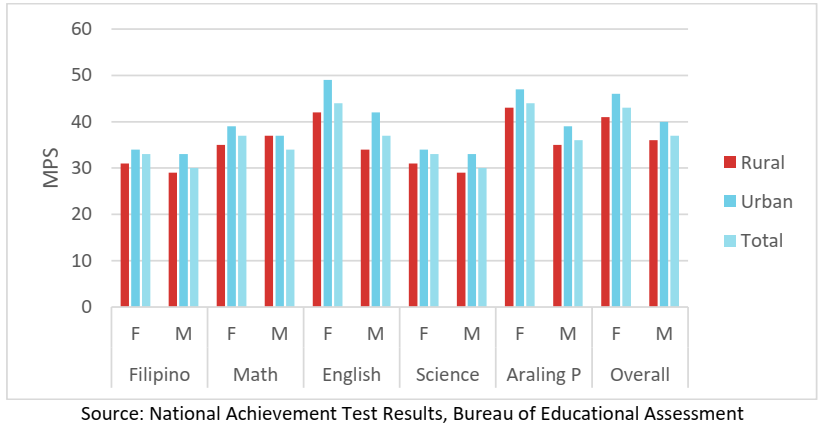
Figure 6 shows that urban females perform better than urban and rural males in all subjects. However, in one anomalous result, rural males performed better than rural females in Mathematics, although all results are still in the low proficiency rank.
Secondary
Four separate secondary education assessments were administered to students between Grade 7 and Grade 12.
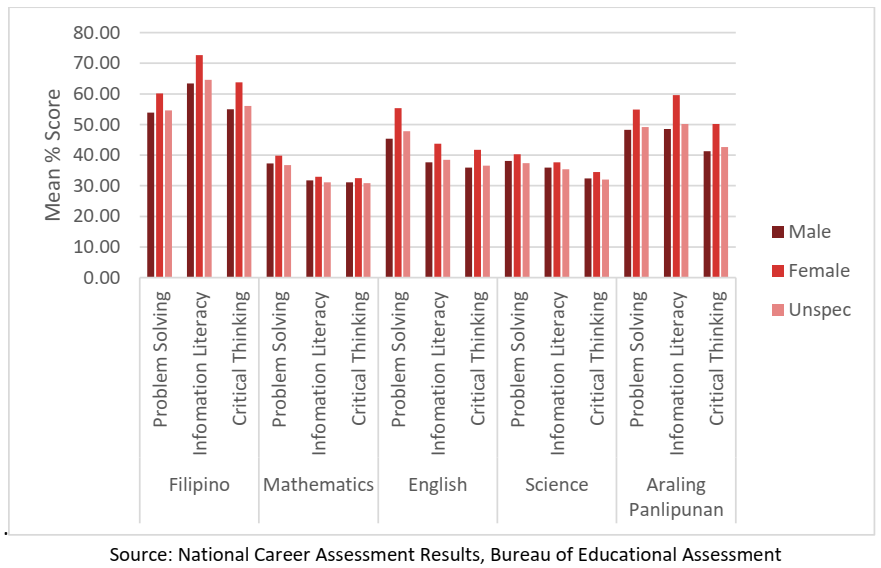
National Career Assessment Examination (NCAE)
NCAE is administered to Grade 9 students in SY2017-18 and SY2018-19 to determine learners’ aptitudes and occupational interests for career guidance.
Table 7 shows the results of this assessment. Results for 2019-20 are unavailable due to COVID-19 preventing the holding of the test during SY 2020.
The test result categories of performances are assessed as follows:
High Aptitude: 75-100%; Moderate Aptitude: 50-74%; Low Aptitude: 0-49%
Table 7: General Scholastic Aptitude (MPS) for SY 2017-2018 and SY 2018-2019 by Gender
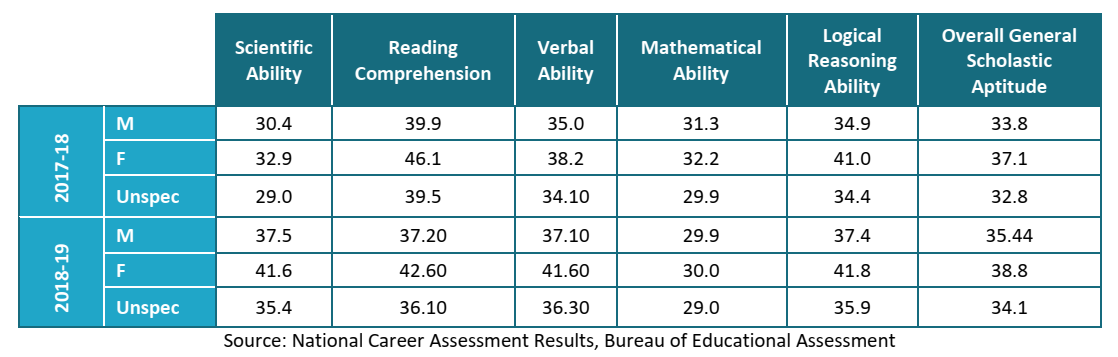
The data across both SY2017-18 and SY2018-19 shows that the MPS for all measures of aptitude in all assessed areas at Grade 9 are at a “Low Proficiency” level throughout. Females scored higher than males in every category. The data needs to be carefully scrutinized to understand why so many students display such low aptitudes in all areas and not only in STEM-related subjects.
National Assessment Test (NAT) for Grade 10
NAT for Grade 10 is seen as an “exit assessment” to determine if students are meeting the learning standards of junior high school education (Grades 7-10).
As stated earlier for elementary education, the NAT 2017-2018 and NAT 2018-2019 test results are not comparable to the previous NAT tests because of the introduction of 21st-century skills into the tests across the core subjects and the changed analysis based on proficiency levels.
Unfortunately, results for SY 2018-2019 are unavailable due to a logistics problem in BEA; results for SY 2019-2020 are also unavailable because the banning of face-to-face interaction brought about by COVID-19 meant that NAT testing is usually conducted at the end of the school year was not possible.
The BEA uses the same assessment scale and rubrics used at the elementary level for the NAT test scores at the secondary level.
Summary national data at Grade 10 level for SY 2017-2018 and the three 21st-Century Skills of Problem Solving, Information Literacy and Critical Thinking and the five subjects of Filipino, Mathematics, English, Science, and Araling Panlipunan are shown in Figure 7.
With only one year of testing data available using the changed test, it is impossible to discern trends across two or more tests, but similar results for NAT Grade 6 were obtained. Students perform better in their national Filipino language than in every other subject.
Figure 7: Mean Scores by 21st Century Skills by Subject, NAT 2017-2018
Analysis by proficiency level for Grade 10 in the 21st Century Skills area indicates that Filipino is the only subject where students achieve a “nearly proficient” (score range 50-74).
The performance in Araling Panlipunan is also close to “nearly proficient,” but English, Mathematics, and Science are all within the “low proficiency” range.
These low scores are a cause for concern as Araling Panlipunan is widely expected to teach the value of nation-building; English is supposed to be a comparative advantage of the Filipino labor force, but the results for the English language are also at “low proficiency.”
When mean scores are analyzed by subject area, 21st-century skills, and disaggregated by gender (figure 8), the female mean score is higher than the males’ score in every category and all subjects.
Figure 8: Mean Scores by 21st Century Skills by Subject and Gender, NAT 2017-2018
National proficiency levels for NAT Grade 10 for the four subject content areas of Filipino, Mathematics, English, Science, and Araling Panlipunan are shown in Figure 9.
Figure 9: Mean Proficiency Scores by Subject, Grade 10 NAT 2017-2018
The data reveals that the mean score in Filipino and Araling Panlipunan is “nearly proficient”; English score shows more than 60% low to zero proficiency, and the STEM subjects (mathematics and science) are languishing with more than 80% at low or zero proficiency.
When rural and urban locations are also compared (by gender), the same trends in other data sets occur, as shown in Figure 10, but the differences are much less pronounced at the Grade 10 level.
Urban female students outperform rural female and male students in all subjects except Mathematics, where rural males and females are more evenly matched.
Figure 10: NAT 2017-2018 Grade 10 MPS, by Gender and Location
Program in International Student Assessment (PISA 2018)
PISA 2018 is an assessment tool administered every four years by the Organization for Economic Cooperation and Development (OECD) to measure 15-year-olds’ ability to use their reading, mathematics, and science knowledge and skills to meet real-life challenges.
The number of countries participating in PISA has been steadily increasing, and the Philippines participated for the first time in the 2018 round.
English was nominated as the language of testing because secondary school subjects in the Philippines are being taught in English. The test assumes that the test-takers should have reached a sufficient understanding of English to work on the PISA test without encountering linguistic problems.
Test results are reported for each subject area under seven Proficiency Levels that range from the lowest level (Level 1a/1b) to Level 6 (which is the highest).
PISA provides a minimum proficiency level benchmark and an OECD average across all participating countries. The 2018 test was “computer-based” for the first time, assuming respondents are competent to encode responses correctly.
The areas covered by PISA 2018 are as follows:
Reading Literacy is the students’ capacity to understand, use, evaluate, reflect on and engage with texts in order to achieve one’s goals, develop one’s knowledge and potential, and participate in society.
Mathematics Literacy is the students’ capacity to formulate, employ and interpret mathematics in a variety of contexts. It includes reasoning mathematically and using mathematical concepts, procedures, facts and tools to describe, explain and predict phenomena.
Science Literacy is the students’ ability to engage with science-related issues, and with the ideas of science, as a reflective citizen. A scientifically literate person is willing to engage in reasoned discourse about science and technology, which requires the competencies to explain phenomena scientifically, evaluate and design scientific enquiry, and interpret data and evidence scientifically.
For 2018, Reading Literacy was assessed as a major domain, and the students’ Mathematical Literacy and Scientific Literacy were assessed as minor domains.
Global Competence was also included as an innovative assessment for this test.
(from PISA 2018 National Report of the Philippines)
Key Findings from PISA
Only 68 percent of 15-year-olds in the Philippines participated in PISA 2018, suggesting that a sizable proportion has left school by age 15. The World Bank also reported that about 4 percent of 15-year-old girls were not in school, compared to 16 percent of 15-year-old boys.
In addition, there was a noticeable grade-age mismatch due to late entry and grade repetition. In grades 9 and 10, students who had repeated a grade once scored as much as 94 points lower in reading than peers who had not repeated a grade.
About half of PISA students (51 percent) were in Grade 9, with 31% in Grade 10. This distribution between grades seems to be quite significant in terms of student performance since Grade 10 students performed better than Grade 9 students (on average).
Summary details only will be included here. There are volumes of data and analysis available, which can be accessed if more detailed data about the individual test component scores and more detailed analysis is required. Reading, mathematics, and science literacy will be summarized below using the same results framework for each one (gender, student grade level, private or public school, urban or rural school)
Reading Literacy – Filipino students obtained an average score of 340 points in Overall Reading Literacy, significantly lower than the OECD average of 487 points (Proficiency Level 3). Only 1 in 5 Filipino students (19.4%) achieved at least the minimum proficiency level (Level 2) in Overall Reading Literacy.
Most Filipino students (80.7%) were classified as having Proficiency Levels below Level 2, with 54.4% below Level 1 proficiency. This means that most students cannot identify the main idea in a piece of text of moderate length and may have difficulty making comparisons based on single features of text and making connections between text and outside knowledge. They can also not represent the literal meaning of single or multiple texts without explicit content or organizational clues.
There were marked differences in results between genders in Reading Literacy. Neither males (84.8%) nor females (76.9%) obtained the minimum proficiency level (Level 2), but females performed significantly better than males, with a 27-point difference in Overall Reading Literacy.
Senior High School (SHS) students aged 15- year-old scored significantly higher (mean score of 428 points) than did the candidates still in Junior High School (JHS) (339 points), which may be due to the extended curriculum at the SHS level and more experience with computer-based test processes.
Regional differences in Reading Literacy were not significant, with the National Capital Region (NCR- Luzon), Region 7 (Central Visayas), and Region 11 (Southern Mindanao) achieving the highest Overall Reading Literacy average performance for their respective island groups. The mean Reading Literacy score for students residing in urban communities (355 points) was significantly higher than the mean score of those living in rural communities (313 points).
The mean average score for private school students (390 points-Level 1a) was significantly higher than the score for public school students (328 points-Level 1b). However, both mean scores were below the OECD average, with more than half (59.04%) the number of students in private schools and 85.46% of students in public schools who did not reach the minimum level of reading proficiency (Level 2).
More students in private schools (3.47% ) were at Proficiency Level 4, while only 0.57% of students from public schools reached the same level. Similarly, 13.65% of private school students were at Proficiency Level 3 compared with only 3.17% of public-school students. Finally, 0.21% of students in private schools and 0.02% in public schools were at Proficiency Level 5.
Mathematics Literacy – Filipino students obtained an average score of 353 points in Mathematical Literacy, significantly lower than the OECD average of 489 points (Proficiency Level 3). Only 1 in 5 Filipino students (19.7%) attained proficiency levels 2 to 4. These students can employ basic algorithms, formulae, procedures, or conventions to solve problems involving whole numbers.
As for Reading, most Filipino students (80.7%) were classified as having Proficiency Levels below Level 2, with 54.4% below Level 1 proficiency. Only 0.01% of students performed within Proficiency Levels 5 to 6.
They can develop and work with models for complex situations, identifying constraints and specifying assumptions. They can also apply this insight, understanding, and mastery of symbolic and formal mathematical operations and relationships to develop new approaches and strategies for attacking novel situations.
It is noteworthy that the PNU study found that the K-12 curriculum does not relate mathematics to real-life situations, which appears to account for the serious gaps in students’ ability to deal with the tasks set in Proficiency Levels 5 to 6.
When gender responses are considered, female students’ average Mathematical Literacy score was 358 points (Proficiency Level 1), significantly lower than the average score of OECD female students (487).
In comparison, the mean score of male students from the Philippines (346 points) fell below Level 1 proficiency and was significantly lower than the OECD mean score of male students (492).
It is noteworthy that no significant difference was found between the mean OECD average scores of female and male students, with male students performing marginally better than female students in the OECD averages.
However, female students performed significantly better than male students in Mathematical Literacy in the Philippines, which goes against the trend noted in the international data.
Senior High School (SHS) students aged 15- year-old scored significantly higher (mean score of 448 points or Proficiency Level 2) than did the candidates still in Junior High School (JHS) (352 points which are below Level 1 mathematics proficiency).
Hence, SHS students can generally interpret and recognize situations requiring no more than direct inference. In contrast, an average JHS student still struggles to answer basic and straightforward mathematical problems.
Regional differences in Mathematics Literacy were apparent, with Region 3 (Central Luzon), Region 4A (CALABARZON), Region 7 (Central Visayas), National Capital Region (NCR – Luzon), and Cordillera Administrative Region (CAR) achieving average scores at Proficiency Level 1. The national average of 353 points was below Level 1 proficiency.
The mean Mathematical Literacy score of students residing in urban communities was 365 points, significantly higher than the mean score of students from rural communities (329 points).
The proportion of students within Proficiency Levels 1 to 5 was higher in urban communities, with the proportion of Proficiency Level 3 students in urban communities (6.53%) being nearly five times that of the rural communities (1.33%). For Proficiency Level 2, the proportion of students in urban communities (16.86%) was more than twice that in rural communities (7.80%).
There was a significant difference in Mathematics Literacy between public and private schools, with the mean score for Mathematical Literacy of students in private schools (395 points) significantly higher than the mean score of students in public schools (343 points).
The BEA review of PISA notes that “a majority of the students in public schools (59.22%) and one-third of the students in private schools (33.18%) were below Level 1 proficiency … the proportion of Proficiency Level 2 students in private schools (23.29%) was more than twice of students in public schools (11.45%)…there were nearly four times as many students in private schools (11.49%) who reached Proficiency Level 3 compared to students in public schools (3.14%).” However, high performers within Proficiency Levels 5 to 6 were found to be few in both public (0.03%) and private (0.30%) schools” 121.
Scientific Literacy – The Philippines fared significantly lower in Scientific Literacy than all the ASEAN countries participating in PISA 2018. Filipino students obtained an average Scientific Literacy score of 357 points (Proficiency Level 1a), significantly lower than the OECD average score (489 points or Proficiency Level 3).
Proficiency Level 1a means that an average Filipino 15-year-old student can use basic science knowledge to recognize or identify explanations of scientific phenomena.
They can make structured scientific inquiries with at most two variables with additional guidance. In comparison, a typical 15-year-old student from OECD countries at Proficiency Level 3 can draw upon moderately complex content knowledge to construct explanations of familiar phenomena.
A mapping of the K-12 curriculum conducted by researchers from Philippines Normal University (PNU) found that Earth and Space Science are absent from the K-12 curriculum. This would have presented severe obstacles to Filipino students even though the tests are not content-specific.
There was a significant difference between the average scores of 15-year-old students in SHS (439 points – or Proficiency Level 2) and those in JHS (356 points or Proficiency Level 1).
Notably, no SHS student fell below Level 1b proficiency, while 7.53% JHS students did. The proportion of SHS students at Proficiency Level 2 (27.14%) was nearly twice the proportion of JHS students (15.28%) at the same level.
Meanwhile, the proportion of Proficiency Level 3 SHS students (26.76%) was nearly five times as much as those in JHS (5.46%). These findings show that the grade levels of the 15-year-olds taking the PISA test are essential variables.
The PNU study found that “the distribution of content topics is not proportionately and appropriately spread across grade levels. Moreover, the learning competencies are not proportionately and appropriately distributed across grade levels regarding cognitive demand. A high concentration of learning competencies involves tasks of low-level cognitive demand”.
The average Scientific Literacy score of female students was 359 points (Proficiency Level 1a), which is not significantly different from the average score of Filipino male students (355 points-also Proficiency Level 1a). The OECD average scores for male and female students were within Proficiency Level 3.
Regional differences were again computed for Scientific Literacy, but such data is very “broad-brush,” and it is difficult to identify the divisions or schools that may be responsible for any variation in results.
The National Capital Region (NCR-Luzon) achieved the highest Scientific Literacy scores across the country, and Region 7 (Central Visayas) and Region 11 (Southern Mindanao) attained the highest mean scores in the other major islands of Visayas and Mindanao, respectively.
The national average score of 357 points was surpassed by four regions only: Region 4A (CALABARZON), Region 7 (Central Visayas), National Capital Region (NCR), and Cordillera Administrative Region (CAR).
The average Scientific Literacy score of students in urban communities was 370 points (Proficiency Level 1a), significantly higher than the average obtained by rural communities (333 points – Proficiency Level 1b).
The average Scientific Literacy score of students in private schools was 399 points, which was significantly higher than that of public schools (347 points), but both average scores were within Proficiency Level 1a.
The proportion of students below Level 1b proficiency in public schools (8.18%) is almost twice those in private schools (4.34%), with similar results within Proficiency Level 1b, where there were 38.65% of students in public schools and 20.31% of students in private schools.
As for the other subjects, only 0.52% of students in public schools reached Proficiency Level 4, while 3.18% of students in private schools reached this level. Students within Proficiency Levels 5 to 6 were few in both public (0.01%) and private (0.25%) schools.
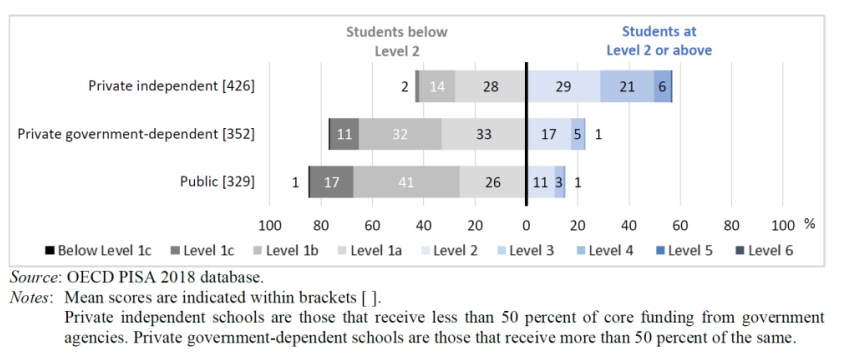
In summary, the analysis of results across the mainly cognitive variables in the three areas of Reading, Mathematics, and Scientific Literacy shows a remarkable consistency in that 15-year-old students are performing at low levels of proficiency across all subjects; females outperform males in all subjects; students in SHS outperform those of the same age at JHS; urban centers perform significantly better than rural centers; some regions perform better than others, but the differences are small, and private school students perform at a higher level than do public students.
This latter point can be analyzed further. Independent private schools (that do not rely on government support) performed significantly better in all three subject areas than government-dependent private and public schools. Figure 11 shows that 56% of independent private school students performed at Level 2 or better than only 15% of public-school students.
Figure 11: PISA 2018 Mean Reading Scores, by School Ownership
The disparity of results across types of school management, school levels, administrative regions, gender, and types of community needs to be considered, even if the differences are small.
It may be helpful if future test analysis could be disaggregated to a divisional level so that more valid comparisons might be made between teaching and learning strategies within divisions rather than the broad-brush reporting of regional results.
There are several questions raised when the performance of the Philippines is compared to all other ASEAN nations. The Philippines was placed at the bottom of each of the content areas of all ASEAN nations, and the defining reasons must be discovered.
One important variable that must be considered is the choice of English as the test language for the Philippines when all other ASEAN countries choose to be tested in their local language. In Malaysia, for example, three separate local languages (Chinese, Malay, and Tamil) are used.
Basic Education Exit Assessment (Grade 12)
Basic Education Exit Assessment (Grade 12) is an additional form of the National Achievement Test (NAT) introduced with the change to Kto12. The NAT Grade 12 represents a summary assessment tool (exit assessment) administered at the end of Grade 12.
The assessment tested seven grouped content areas: Science, Philosophy, Humanities, Media & Information Literacy, Mathematics, Language & Communication, and Social Science. With proficiency level assessments the same as those for the NAT Grade 6 and Grade 10 (Highly Proficient: 90-100; Proficient: 75-89; Nearly Proficient: 50-74; Low Proficiency: 25-49 and Not Proficient: 0-24).
For SY 2018-2019, 1,263,963 Grade 12 students took the assessment: Female 676840 (53.55%); Male 585660 (46.33%); Unspecified gender 1463 (0.12%).
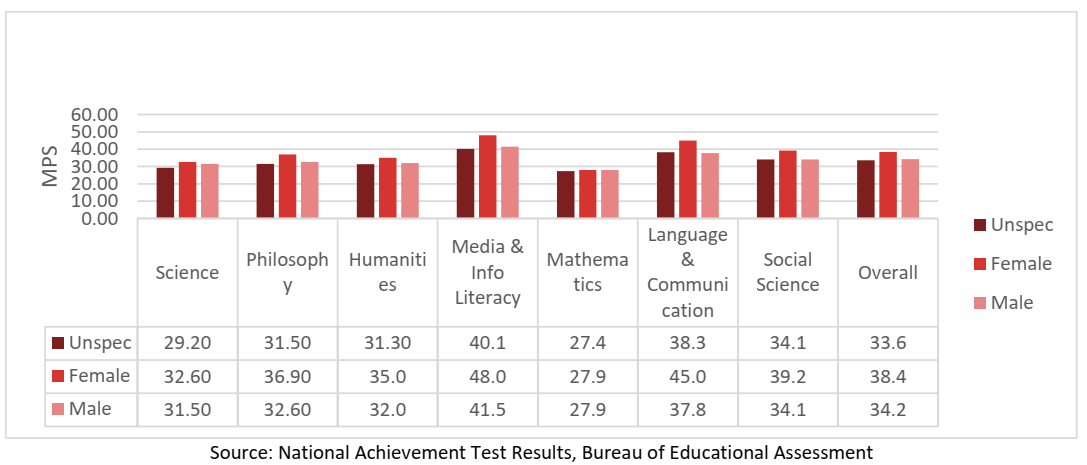
The overall mean percentage scores disaggregated by gender are shown in Figure 53. As for all previous NAT and the ILSA tests, females outperformed males except for Mathematics, where the MPS was the same.
Figure 12: Basic Education Exit Assessment (Grade 12) by Gender, SY 2018-2019
When proficiency levels were computed and disaggregated by gender with all subject performances combined, the results shown in Figure 13 lie predominantly in the Low Proficiency category (which is similar to PISA and NAT Grade 6 results reported previously).
Figure 13: NAT Grade 12 Overall result for all subjects, by Gender
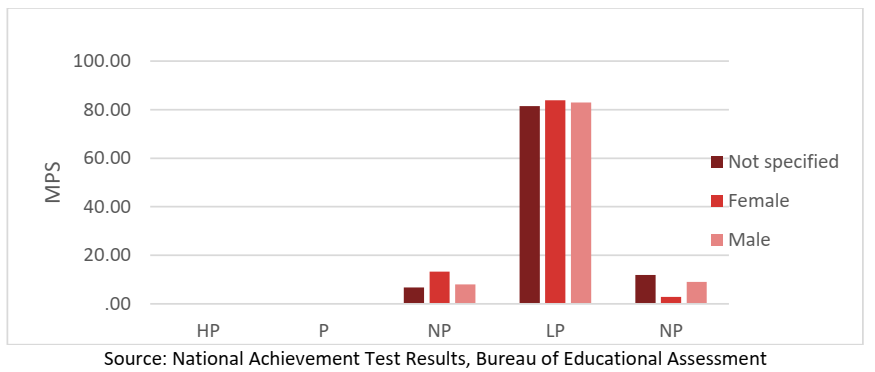
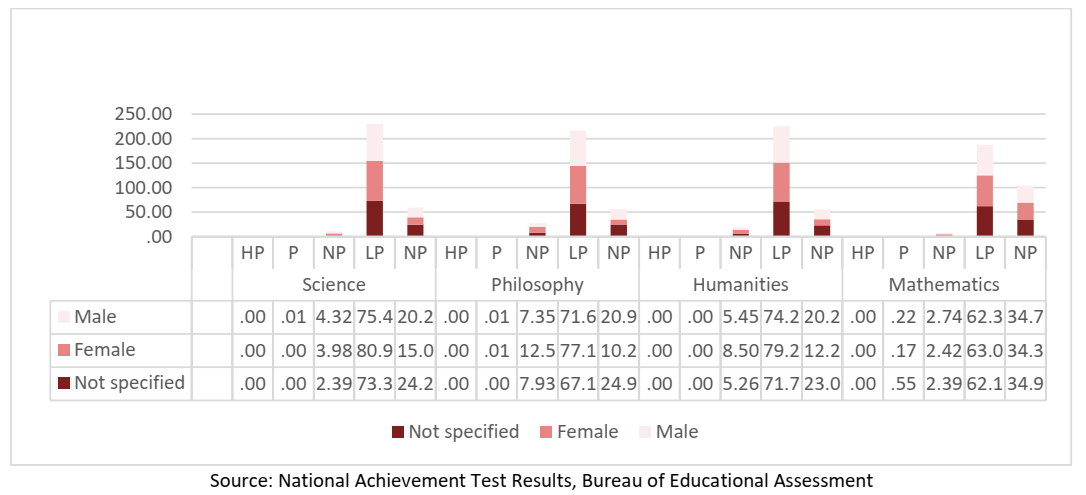
Figure 14 below shows that for Science, Philosophy, Mathematics, and Humanities, there were no completers in the High Proficiency category in all four subjects, and only 0.1% in the Proficient category (in Science).
More than 70% of Grade 12 completers were classified at a low proficiency level. At the Grade 12 level, the gender differences apparent in the earlier grades of basic education have decreased slightly – in Mathematics, males and females were performing at similar levels. However, females once again outranked males in Science, the Humanities, and Philosophy.
Figure 14: Scores for Grade 12 in Science, Philosophy, Humanities and Mathematics, by Competency and Gender
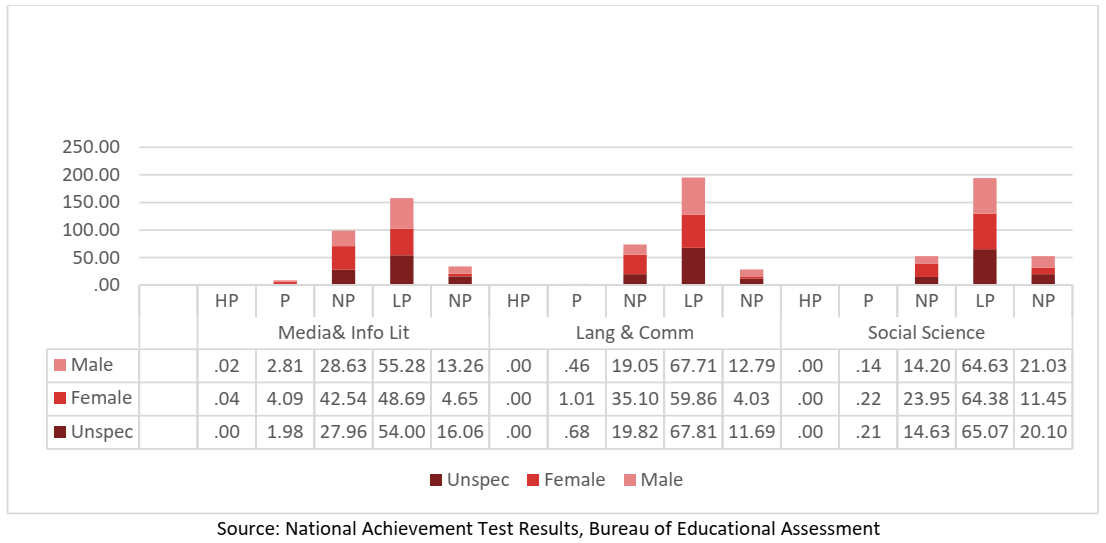
Media and Information Literacy was the only subject in the Grade 12 BEEA where any students reached the Highly Proficient category. Nevertheless, more than 60% of students were in the low proficiency category. All other subject areas had most students in the Low Proficient level or below.
Figure 15: Scores for Grade 12 in Media & Info Lit, Lang & Comm and Soc Sci (by Competency and Gender)
The exit assessment conducted at the end of Grade 12 is an important measure of student cognitive ability attained over 13 years of basic education.
Unfortunately, the level of proficiency as measured in the NAT Grade 12 test (BEEA) is very low. It correlates closely with all other forms of student assessment (national and international) documented here.
Few students across the Philippines can perform at the Near Proficiency level. The PISA results suggest that most students who reach Near Proficiency or Proficiency levels are probably in private or special purpose subject-based schools.
DepEd implements special programs that cater to selected students’ unique skills and talents through several selective high schools and TVET institutions.
Figure 16: Enrollment in Special Programs, SY 2019-2020
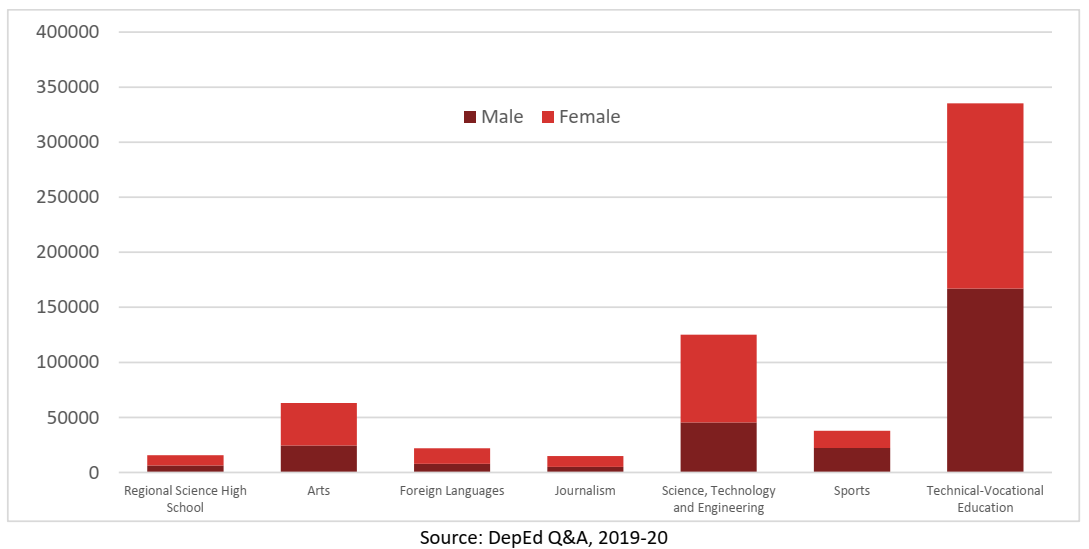
Figure 16 shows that in SY 2019-2020, 140,705 students were enrolled in science-oriented enhancement programs, while 335,397 were enrolled in special TVET programs.
Another 137,686 students were enrolled in special programs for the Arts, Foreign languages, Journalism, and Sports. Places in these programs are highly competitive, and specific criteria are used to select high-performing students for places in these programs.
Further research is needed to determine whether specific strategies are used in these schools (apart from selecting high-performing students) that improve learning outcomes that other public schools might use nationwide.
For example, are resources and equipment more modern? Are teachers markedly different in competence and experience than teachers in mainstream public schools?
Accreditation and Equivalency Assessment (A&E)
A&E is a test to be taken by out-of-school youth and adults to certify completion of elementary and secondary education. A&E learners may also take the National Career Assessment Examination (NCAE) to determine their aptitude for future careers.
The A&E tests cover 21st-century skills based on the Alternative Learning System strands as follows:
- Strand 1. Communication Skills
- Strand 2. Critical Thinking and Problem Solving
- Strand 3. Sustainable Use of Resources and Productivity
- Strand 4. Development of Self and a Sense of Community
- Strand 5. Expanding One’s World Visio.
Test passers at elementary and junior high school levels are given certificates for Grades 6 and 10, with final assessment ratings determined by 50% written assessment results and 50% portfolio content.
The portfolio contains work samples (weighting of 40%) and projects with corresponding rubrics (weighting of 60%).
Elementary A&E
The results for the Elementary A&E tests taken in 2018 and 2019 are shown in Figure 58 below. Unfortunately, the results are not gender disaggregated.
Figure 17: A&E Elementary (20018 and 2019) Institutional Performance Profile
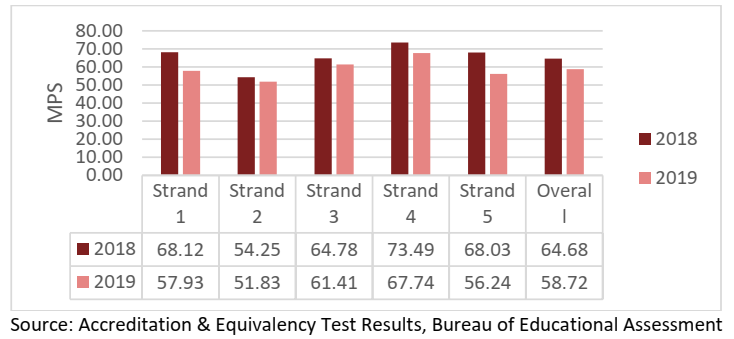
There were 15,554 Elementary candidates in 2018, with a 65% increase to 25711 candidates in 2019. The results show a drop in the mean performance scores in each of the five strands from 2018 to 2019, which may be attributable to the dramatic increase in numbers enrolling for the A&E tests.
Junior High School (JHS)
The results for the Junior High School (JHS) A&E tests taken in 2018 and 2019 are also shown in Figure 18 below. Again, the results are not gender disaggregated.
Figure 18: A&E JHS, Institutional Performance Profile, 2018 and 2019
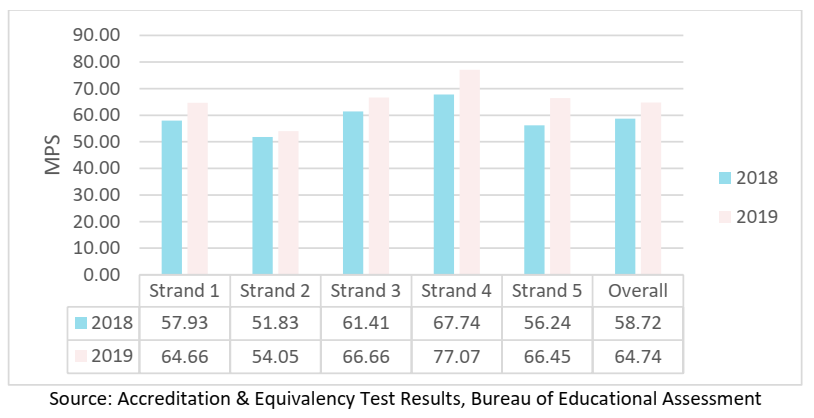
There were 133,165 candidates in 2018, with an 84% increase to 244,694 candidates in 2019. The results also showed a drop in the mean performance scores in each of the five strands from 2018 to 2019.
For the JHS equivalence results, the significant increase in numbers enrolling for the A&E tests may account for the drop in the overall ratings from 2018-2019.
READ:
Bullying and School-Related Gender-Based Violence in the Philippines
The Education Situation of Vulnerable Groups in the Philippines
Equitable Access to Quality Education in the Philippines
Education Policy Priorities and Reform in the Philippines
Addressing Gaps in DepEd Developed Learning Resources
DepEd Projected Classroom Shortages in Case of Limited to Full Face-to-Face Classes
The Importance of a School-Based Management System (SBM)
Total Number of DepEd Teachers by Position Title and Level of Education
Number of Teachers by Teaching Assignment not in Area of Specialization
The Proportion of Teachers With Teacher III and Master Teacher Positions
Unfilled Positions in DepEd by Regions
Overall Passing Rate in Licensure Examination for Teachers (LET)
Administrative Cases Filed by Private Lending Institutions Against DepEd Personnel
Classroom Shortages in the Philippines
Source:
Office of the Undersecretary for Administration (OUA)