By law, every Filipino has a right to free basic education. However, millions of children, youth, and adults dropped out of school before finalizing basic education or never enrolled.
Table of Contents
Out-of-School Children and Youth (OOSCY)
The Philippine Statistics Authority (PSA) estimates a total of 3.6 million Out-Of-School Children and Youth (OOSCY) aged 6-24 in 201780 81. Two-thirds of them are females.
There were around 205,000 OOSCY for ages 6-11, while there were around 398,000 for ages 12-15. Strong incentives encourage OOSCY aged 6-15 to return to formal schooling, but this becomes challenging the more prolonged the children are away from school, and they slip further behind their age group.
A PIDS study found that being overage is a significant factor in dropping out. It finds that “when children are older than their cohorts, they lose interest and motivation because they are embarrassed and at risk of being bullied and developing attitude issues as they progress to the higher grades.”
Most OOSCY (83.12%) were in the 16-24 age group, including the target ages for the Senior High School level and the Alternative Learning System.
Out of School Children and Youth (% distribution) by Per Capita Income Decile and Gender
Figure 1: Out of School Children and Youth (% distribution) by Per Capita Income Decile and Gender, 2017
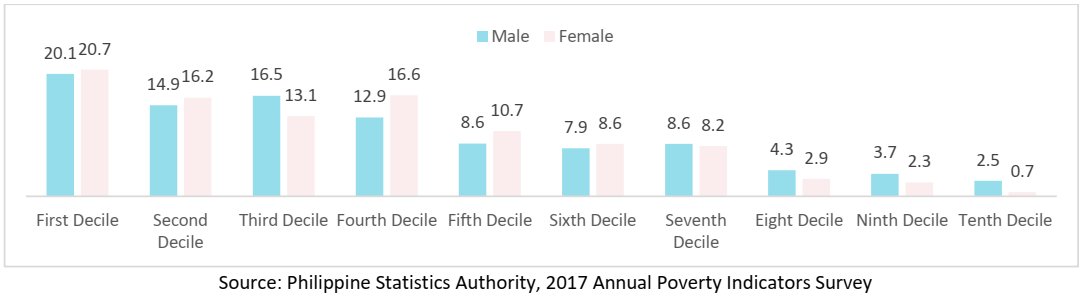
Figure 1 shows that the poor are more likely to be out of school. Two-thirds (66.6%) of female OOSCY come from the bottom 40% of the population, while the corresponding figure for males is 64.4%83.
The corresponding figures for deciles five to seven also cast doubt on the country’s income distribution, as it still represents significant levels of OOSCY.
Overall, females represent 63.31% of total OOSCY, but they comprise 70% of OOSCY in the 16-24 age group. This is most likely due to early marriage, teen pregnancy, and demands from the family for them to stay home as child carriers and other family matters.
The primary reason for not attending school is widely believed to be poverty and the associated costs of attending school.
Data from the Philippine Statistics Authority (PSA) suggests that “marriage/family matters” is the primary reason for not attending school for young adults aged 16-24, reiterating the earlier reasons for low attendance in school. It may also be a lack of parental or spousal support for the schooling of females due to traditional or cultural norms and perceptions.
Reasons for Not Attending School by Gender and Age
Table 1: Reasons for Not Attending School by Gender and Age, 2017
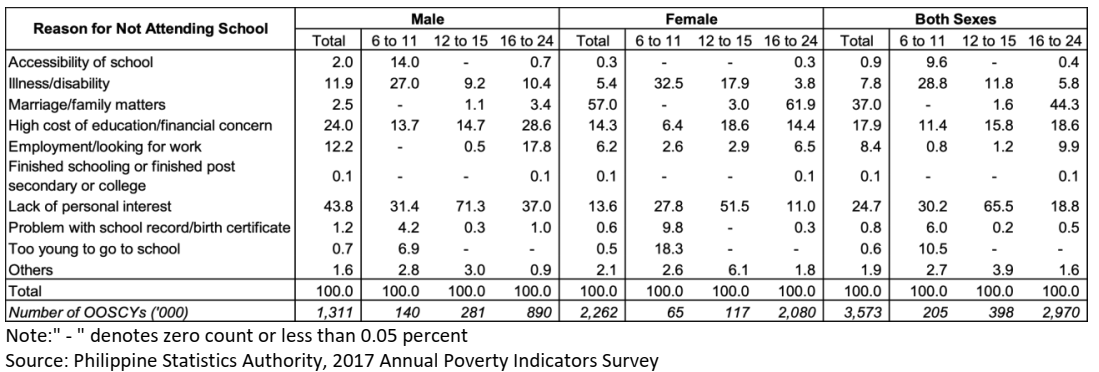
Table 1 shows that the reasons for not attending school differ depending on the age and gender of the students. Teenagers aged 12 to 15 are not in school mainly because of a lack of personal interest, which may be related to the school environment, the relevance of the curriculum, or the pedagogic methods teachers use in the classrooms.
Table 1 shows that males are more prone to non-attendance, being more affected by peer pressure, risky behavior, or the pressure of needing to augment the family income by working. Males mentioned this 30% more than females. PIDS also found that children residing in regions with high student-to-teacher ratios are likely to lack interest.
PIDS found a more complex picture of what explains this survey response, as they found that no matter the poverty level of a family, there is a full appreciation of the importance of schooling.
Conversely, one factor related to poverty is the suggestion that perhaps the poor value education less than the rich because of the time and amount of investments required to attain it. Both elements are essential in the search for solutions to the number of children/youth out of school.
The survey response most directly related to poverty is “high cost of education/financial concern.” PSA reports that Filipino families spend an average of 3.2% of household income on education.
Unfortunately, the bottom 30% of families in terms of income spend only 2% of household income on education, compared to 3.4% for the richest 70% of families.
In addition, because males report the need to work twice as much as females in the group 16-24, there is prioritization when it comes to rationing household resources for education.
Related to this is the finding that males are more likely to leave school to look for work, whether informal or manual and the perception that males best do this type of work.
Another reason for not attending school is illness/disability, especially for children aged 6-11. However, there is no disaggregation between what represents “illness” and what is “disability.”
Illness may be long-term or just temporary (but long enough to make schools decide to classify the student as a dropout). However, disability is a more permanent issue, as it persists throughout the individual’s lifetime.
Unfortunately, inclusive leadership, principles, and cultures have yet to be fully established at all levels of the education system to allow children with disabilities to participate fully in schools.
PIDS confirms the conventional thinking that “school attendance remains largely an economic issue.” It is important to remember that the reasons cited above are not mutually exclusive.
A person who responds with a “lack of interest” in the survey may also be “looking for work” simultaneously. One might have “family matters” but also suffer from the “high cost of education.”
Remote Communities
The government has identified geographically isolated and disadvantaged areas (GIDA) nationwide.
This refers to communities with marginalized populations physically and socio-economically separated from the mainstream society and characterized by:
- Physical factors – isolated due to distance, weather conditions, and transportation difficulties (island, upland, lowland, landlocked, hard to reach, and unserved/underserved communities) and
- Socio-economic factors – high poverty incidence, presence of vulnerable sector, communities in or recovering from a crisis or armed conflict.
There are 10,875 GIDA barangays nationwide, representing 25.87% of all barangays. Regions V, VIII, and IX have the most GIDA barangays, representing 31.23% of the total among the three regions.
Nonetheless, the figures for all regions are high, reflecting the slow pace of rural development. In this scenario, it is understandable that many areas still do not even have an elementary school.
Number of Geographically Isolated and Disadvantaged Areas (Gida) Barangays per Region
Figure 2: Number of Geographically Isolated and Disadvantaged Areas (Gida) Barangays per Region, 2019
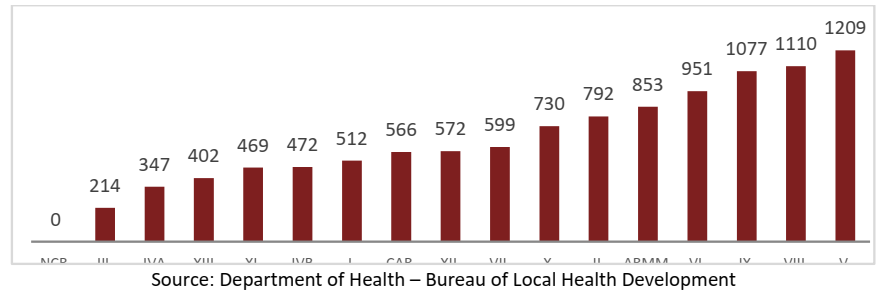
Figure 2 shows that the farther barangays are from the National Capital Region, the worse off the barangay is in terms of vulnerability and poverty incidence.
There are 8,013 barangays without elementary schools. Most are in geographically isolated areas with peace and order problems and in city barangays where the size of the barangay is smaller than those in the adjacent provinces and can be served by schools in nearby barangays.
There are eight municipalities without secondary schools. These municipalities are primarily located in Basilan and Maguindanao’s conflict-affected areas in BARMM and Palawan.
In order to identify disadvantaged schools, DepEd created a multi-dimensional indicator called the Hardship Index. This brings together variables such as travel cost to Schools Division Offices (SDOs), poverty incidence, violent acts, lack of utilities (i.e., electricity, water & internet), and need for temporary learning spaces.
Initially, this index was used to identify eligible recipients of the Special Hardship Allowance for Teachers. However, the multi-dimensional nature of the index, as well as the coincidence of various dimensions of disadvantage in specific locations nationwide, imply that the index can be used for targeting other inclusion programs as well.
There are 1,044 remote and 86 extremely remote schools nationwide based on the result of the remoteness index analysis. Learners prefer to stay at home rather than attend school because of the distance and difficulty of travel.
Also, the lack of provision of school facilities is a problem for these schools, thus affecting the effective delivery of education. All this information should be considered along with the finding of the PSA survey on reasons for not attending school: males aged 6-11 seem to be the only group significantly affected by difficulty accessing school.
Proximity to a school has almost no bearing on the decision to pursue schooling for all other age groups, regardless of gender. This implies that special attention should be given to elementary-aged males in terms of improving participation rates.
For all other groups, the economic issues discussed earlier are more pressing than simply building more schools in remote locations. The closeness of the school is not always important compared to the accessibility of surrounding schools and the unique situation and decision-making of the family based on their surroundings and circumstances.
Children with Disabilities
The right to education as set out in the 1987 Constitution includes all children, with or without disabilities. The DepEd program for children with disabilities (CWD) represents 1,34% of the total enrolment. However, according to the World Health Organization (WHO), about 15% of the world’s population lives with some form of disability.
DepEd estimated in 2010 that there were 5.49 million children with disabilities in the Philippines92. However, in a recent presentation by the Bureau of Learning Division, the estimate of people with disabilities in the Philippines was 1.57% of the total population (some 1.7M people). This leads to the assumption that DepEd is using a more flexible approach.
Despite the DepEd Order No. 72 series of 2009 on inclusive education, there are still barriers to access to education for children with disabilities.
We can highlight the insufficient number of special education centers (84% of municipalities do not have SPEd centers), the lower access of girls to SPEd centers, the inaccessible infrastructure, the lack of trained teachers and specialists, the lack of adequate screening systems and comprehensive support to children with disabilities.
The National Strategic Plan on Children with Disabilities 2019-2022, elaborated by the Council for the Welfare of Children, identifies some gaps in the policies implemented by DepEd Central Office. Including lack of sensitivity to CWD, a one-size-fits-all inclusive education curriculum for CWD, the absence of a school plan for possible CWD students, and the non-inclusion of CWD in the school disaster or emergency plan, among other deficiencies.
This situation is aggravated because vulnerable populations, and CWD among them, are now disproportionately suffering from the impact of COVID-19 on the provision of education.
Disadvantaged Muslim Children and Youth
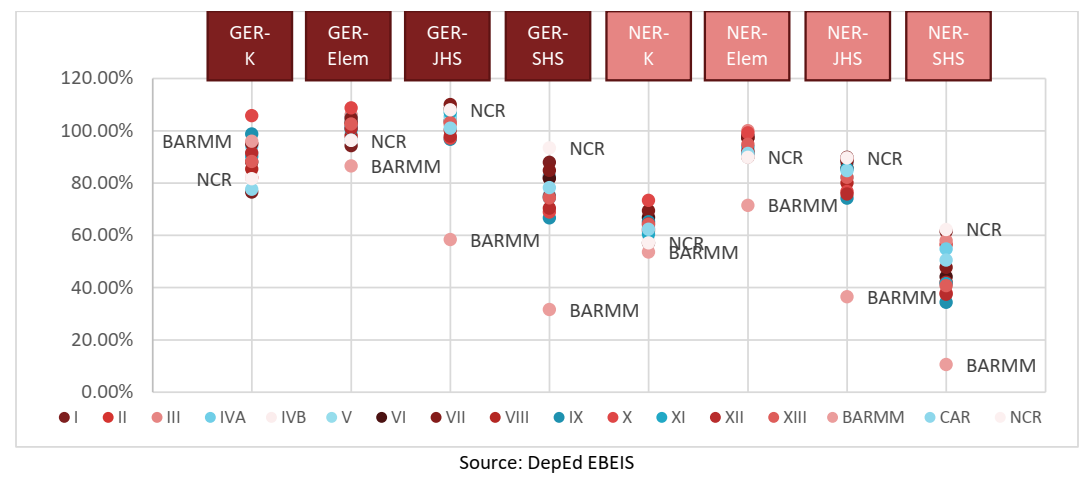
It was mentioned earlier that BARMM has the worst performance indicators related to access. The figure below shows that BARMM is an outlier compared to other regions.
The difference in net enrolment between NCR and BARMM is 3.5 p.p. in Kindergarten, 18 p.p. in Elementary, and a staggering 53 p.p. in JHS and 52 p.p. in SHS.
This disadvantage begins early in schooling: while gross enrollment is competitive at the kindergarten and elementary levels (96.01% and 86.62% compared to the national averages of 90.21% and 101.13%, respectively), in secondary, the figures are 58.38% for JHS and 31.64% for SHS, compared to 102.12% and 78.18% nationally.
This lack of access is worse for males. In addition, BARMM is also an outlier in terms of Elementary School Leaver Rate (4.87%) and Completion Rate (72.94%) when the corresponding averages for other regions are 0.52% and 96.17%, respectively.
In short, fewer students are entering school, more are dropping out, and even fewer are completing elementary school. This sets the stage for continued poor indicators at the secondary school level.
Gross Enrollment Rate (GER) and Net Enrollment Rate (NER) by Region by Level
Figure 3: GER and NER by Region by Level, SY 2019-2020
Gender Gaps
There is gender equality in the participation of boys and girls in Kindergarten up to the end of Elementary (Grade 6).
The gap becomes more evident in junior and senior high school, wherein more females stay in the system.
Male numbers outweigh females in the early years but swing slightly in favor of females starting Grade 7, and the gap widens in senior education.
DepEd data shows a distinct shift in the gender ratio between Grade 8 to 9, from slightly favoring males to significantly favoring females by Grade 12.
Grade 9 students are around age 14, and since it is unlikely that a large number of female-majority enrollment occurs during high school, the shift in the gender ratio may mean the onset of significant male-specific pressures to drop out of school once they become teenagers.
This also points to the possible resilience of girls even in the face of financial and social difficulties.
Gender Ratios in Secondary Education
Figure 4: Gender Ratios in Secondary Education, SY 2019-2020
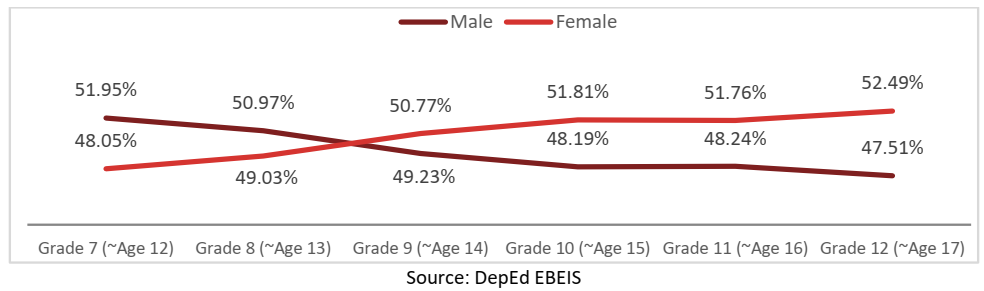
More males than females start secondary education, but as they move to upper grades, the proportion is reversed.
Gross Enrolment Rate and Net Enrolment Rate for All Levels by Gender
Figure 5: Gross Enrolment Rate and Net Enrolment Rate for All Levels by Gender, SY 2019-2020
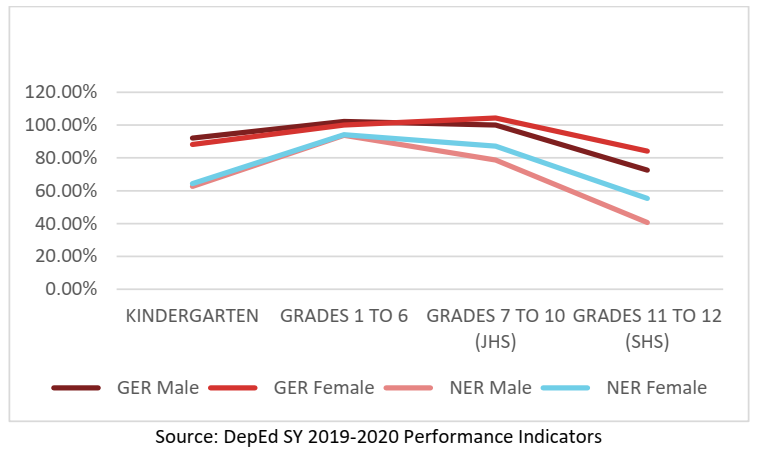
Gross Enrolment Rate and Net Enrolment Rate for All Basic Education Levels
Table 2: Gross Enrolment Rate and Net Enrolment Rate for All Basic Education Levels, SY 2019-2020
| GER | KINDERGARTEN | GRADES 1 TO 6 | GRADES 7 TO 10 (JHS) | GRADES 11 TO 12 (SHS) |
| Male | 92.04% | 102.23% | 100.03% | 72.57% |
| Female | 88.28% | 99.98% | 104.33% | 84.16% |
| NER | KINDERGARTEN | GRADES 1 TO 6 | GRADES 7 TO 10 (JHS) | GRADES 11 TO 12 (SHS) |
| Male | 62.59% | 93.79% | 78.80% | 40.65% |
| Female | 64.31% | 94.15% | 87.20% | 55.34% |
The NER for females is higher than for males in all basic educational levels. However, the total population and enrollment amount are higher for males than females at all levels.
As shown in table 1, the GER is higher for males in Kindergarten and Grades 1 to 6. This means that more females are at the right age in every education level compared to males, who attend school in more significant numbers but less often at the right age.
Various causes have been put forward to explain the higher number of females in basic education. Several studies mentioned that males have lower academic performance than females during their basic education years.
A DepEd study identified that males could work for income, often in the informal sector, earlier than females. However, males are dropping out significantly more than females already in Grade 1.
This is a trend common in many countries in South East Asia. This subject would require further studies so the causes can be better understood.
Inclusion Programs
DepEd is increasingly promoting a rights-based education. According to the Inclusive Education Policy Framework for Basic Education, “Inclusive education contributes to the realization of the Department’s commitment to quality, equitable, culture-based, and complete basic education, which is premised on its mandate to protect and promote the right of every Filipino citizen to such education services.”
In this context, the inclusiveness of the K to 12 Education is expressed through existing DepEd’s inclusion programs such as Special Education (SPEd), Indigenous People’s Education (IPEd), Madrasah Education Program (MEP), Pantawid Pamilyang Pilipino Program (4Ps), Last Mile Schools, Multigrade Program, and Alternative Delivery Modes (ADM).
These programs are groundbreaking and highly relevant. However, the implementation of these programs leaves much to be desired. Enrollment in these programs is low, with no detailed information on the number of vulnerable children and potential youth beneficiaries.
Moreover, learning materials are incomplete, and teaching capacity is uneven among relevant teachers. More recently, the program Last Mile Schools was set to respond to the hard-to-reach areas.
Special Education Program
Appropriate Special Education (SPED) programs and services are provided for learners with disabilities. These programs and services refer to early intervention programs, curriculum adaptations, learning resource support, guidance programs, and transition programs.
To address the learners’ health and medical needs, the schools’ referral system to medical and allied medical-service providers is an essential part of services for learners with disabilities.
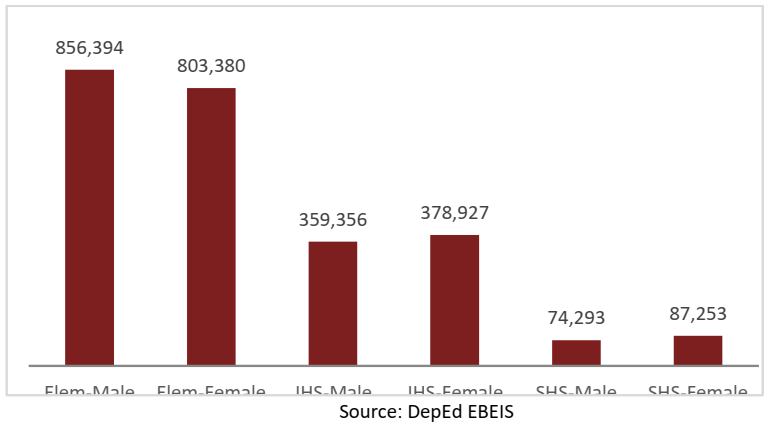
Children and Learners With Disabilities in Special Education Program
Figure 6: Children and Learners With Disabilities in Special Education Program
There were a total of 360,879 children and learners with disability in SY2019-2020. Males represent 57.76% of SPED enrolment, representing a 15.53 p.p. advantage over females.
Statistically, there is no reason more males should exhibit disabilities in any general population; therefore, the wide gender gap can be attributed to other factors determining the school participation of female children and youths with special needs.
The World Health Organization and the World Bank estimated that 15% of the world’s population lives with some form of disability, of whom 2-4% experience significant difficulties in functioning.
The same report predicts that the global estimate for disability is on the rise due to population aging, the rapid spread of chronic diseases, and improvements in the methodologies used to measure disability.
Using these figures, it is possible that there were around 4.82 million children and youth with disability for the age group 5-19 in the country in SY 2019-2020.
Compared with the SPED enrolment for the same year, only 7.5% of the viable SPED population has been served by the program. The “child find program” used by SPED should help identify special-needs learners.
Disadvantaged Indigenous Peoples Learners
The Indigenous Peoples (IP) Rights Act of 1997, also known as Republic Act (RA) No. 8371, mandates all government agencies to recognize and promote the rights of Indigenous Cultural Communities / Indigenous Peoples (ICCs/IPs) within the framework of national unity and development.
With this Republic Act as the major legal basis, substantiated by two years of consultations with IP community leaders and elders, and community-based pioneers and practitioners of Indigenous Peoples Education, the Department of Education (DepEd) issued DepEd Order No. 62, s. 2011 entitled Adopting the National Indigenous Peoples Education Policy Framework. This serves as an instrument for promoting shared accountability, continuous dialogue, engagement, and partnership among government, IP communities, civil society, and other education stakeholders in upholding the IPs Learners’ rights to culture-based education.
In the last 20 years, the Department of Education (DepEd) has been undertaking major reforms to promote and ensure the rights of Indigenous Peoples to basic education consistent with the 1987 Constitution and the Indigenous Peoples Rights Act (IPRA) of 1997 while responding to the global call of Education for All.
Initial steps in this direction were the policy on the permit to operate primary schools for IPs and cultural communities released in 2004 and the Alternative Learning System (ALS) Core Curriculum for IPs in 2010.
Significant reforms in IP Education were set in place starting in 2011 by adopting the National Indigenous Peoples (IP) Education Policy Framework or DepEd Order No. 62, s. 2011, which advocates for and fosters an educational system that is inclusive and respectful of IP learners and communities.
In this vein, DepEd Order No. 62, s. 2011, at the policy level, actualizes key provisions of Republic Act 9155 or the Governance of Basic Education Act, which emphasizes that education shall be responsive to local contexts and conditions based on education plans generated with the local community.
DepEd Order No. 62, s. 2011 was also further reinforced by the implementation of the K to 12 Program, which includes in its principles and standards the curriculum’s being learner-centered, inclusive, and culture-sensitive.
To ensure that critical reforms in IP Education are responsive, contextualized, and sustained, the Indigenous Peoples Education Office (IPsEO) was also created in 2011 and is the focal point for DepEd in planning, implementing, coordinating, and monitoring activities related to IP Education.
In 2014, as DepEd moved towards the succeeding critical tasks to actualize culture-based education at the school level, community leaders and elders reminded DepEd of issues regarding cultural misappropriation and misinterpretation in the process of undertaking culture-based education.
Heeding their wisdom and warning, DepEd issued DepEd Order No. 51, s. 2014 entitled Guidelines on the Conduct of Activities and Use of Materials Involving Aspects of Indigenous Peoples Culture. This policy provides the most basic cultural standards and protocols for all public schools and DepEd offices when undertaking any initiative featuring or including Indigenous Peoples’ culture. It also seeks to rectify such acts that have been observed in the Department and are recognized to have historically contributed to discrimination against IPs and their communities.
Aligning with the implementation of the K to 12 curriculum, capacity building on curriculum contextualization for IPEd, specifically the development of contextualized lesson plans, was nationally coordinated after the release of the IPEd Curriculum Framework in 2015, which recognized the importance of indigenous knowledge, skills, and practices (IKSPs) and indigenous learning system (ILS) for indigenous learners.
DepEd gave due recognition to and promoted the sustainability of ILS and adopted appropriate basic education pedagogy, content, and assessment through integrating IKSPs in all learning areas and processes.
The framework also provides the foundation for community engagement and the interface of the ILS and the national education system. Program Support Fund for IPEd was allocated for use by selected regions and divisions to implement IP education effectively.
The impact of these initial concrete expressions of inclusion of IP learners and communities in the national education system is reflected in enrollment data over the past ten years, where a marked 110% increase in IP learners’ enrollment is seen from SY 2014-2015 to SY 2015-2016. In the succeeding years, fluctuations are observed, but enrollment is maintained above the 2.5 million level.
Indigenous Peoples Learners, Public School Enrollment
Figure 7: Indigenous Peoples Learners, Public School Enrollment, 2008-2020
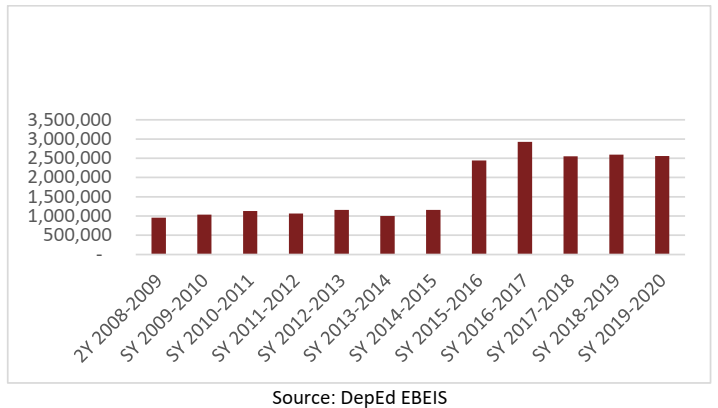
The 110% increase in IP learners’ enrollment cannot be explained solely by a dramatic influx of IP learners who enrolled in public schools in SY 2015-2016.
Based on observations of field personnel of community dynamics, while there may have been additional enrollment of IP learners, which happens annually, the leap in numbers is a result of the cumulative efforts of the Department in partnership with IP communities to create, communicate and institutionalize the respect for cultural integrity and dignity of IP communities as concretized by policies and practices that promote cultural sensitivity and responsiveness towards IP communities and learners.
This change in relational dynamic has encouraged parents and learners to declare their IP ethnicity, which is then captured in enrollment data. The fluctuations in enrollment data from SY 2015-2016 onwards reveal that work still needs to be done to eliminate or correct sources of data inaccuracies. This also reflects the broader social factor of ongoing debates about how IP ethnicity is understood.
Indigenous Peoples Enrolment by Gender and Level
Figure 8: Indigenous Peoples Enrolment by Gender and Level, SY 2019-2020
IP students represented 9.48% of enrolment in SY2019-2020. Almost half of these (47.13%) come from just four regions: BARMM (15%), Region XI (12%), CAR (10%) and Region IX (9.5%).
The gender ratio for this population subset observes the national pattern: more males in elementary; then, it shifts to reflect more females being retained in high school. Almost half of these (47.13%) come from just four regions: BARMM (15%), Region XI (12%), CAR (10%) and Region IX (9.5%).
IP learners are in 41,731 public schools nationwide, or 79.19% of all public schools (down to one learner). Of this, 35,842 schools (85% of 41,731) have 50% and below IP learners’ enrollment and thus need to be approached differently in terms of curriculum contextualization and education governance compared to schools that are dominantly IP learners. This is a significant area of work moving forward.
Madrasah Education Program
Muslim learners have grown steadily since 2015, exhibiting the same patterns as the general population. This is a positive development in integration and tolerance and highlights that significant Muslim populations are found outside Mindanao.
They represent around 5% of total enrolment. While being a Muslim is not automatically a disadvantage, significant segments of the Muslim population suffer from poverty, discrimination, disability, and others that warrant focused attention from DepEd.
Muslim Learners Nationwide, by Gender and Level
Figure 9: Muslim Learners Nationwide, by Gender and Level, 2015-2019
The Madrasah Education Program (MEP) is a comprehensive program in public and private schools that aims to provide appropriate and relevant educational opportunities within the context of Muslim culture, customs, traditions, and interests through the integration of the Arabic Language and Islamic Values Education (ALIVE) in the basic education curriculum.
The Arabic Language and Islamic Values Education (ALIVE) program were instituted in 2010 to provide Muslim learners with appropriate and relevant educational opportunities while recognizing their cultural contexts and unique purposes for participating in the program offerings. It also aims to integrate content and competencies which are relevant and of interest to Muslim learners.
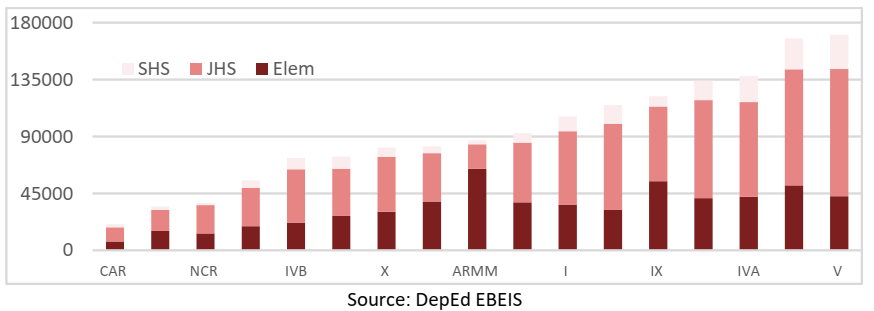
Number of Learners in Arabic Language and Islamic Values Education (ALIVE) Program by Region
Figure 10: Number of Learners in Arabic Language and Islamic Values Education (ALIVE) Program by Region, SY 2019-2020
A total of 168,497 students were enrolled under the Arabic Language and Islamic Values Education (ALIVE) program in SY2019-2020, with almost 89% in elementary school and 11% in secondary school. Four regions in Mindanao represent 87% of enrolment: BARMM (42%), Region XII (21%), Region IX (13%) and Region X (11%).
This program has encountered various issues in the past, including lack of resources, teacher qualifications, and appropriateness of the curriculum. The increased responsibility of the BARMM Ministry of Basic, Higher and Technical Education (MBHTE) is expected to address most of these issues in that region.
Pantawid Pamilyang Pilipino Program (4Ps)
DepEd has a total of 1.6 million students that come from Pantawid Pamilyang Pilipino Program (4Ps) beneficiaries. The conditional cash transfer program provides financial incentives for low-income families that enroll and keep their children in school, thus potentially having a significant effect on participation. Regions V and VI have the most significant share of 4Ps beneficiaries, while NCR and CAR have the lowest.
The allocation of beneficiary slots does not appear to follow a distinct pattern, as the distribution is not mainly influenced by the size of enrollment in the region nor the poverty incidence in the region. Further study on this is desirable.
The third wave impact evaluation conducted by ADB100 found that the school enrollment requirement of 4Ps has led to a 19-percentage point increase in enrollment of 16- to 17-year-old children in beneficiary households.
The program’s effects on the enrollment of children in elementary and middle school are positive but not statistically significant. Effects are confined to females. Children in 4Ps households have a nine p.p. increase in engagement in extracurricular activities.
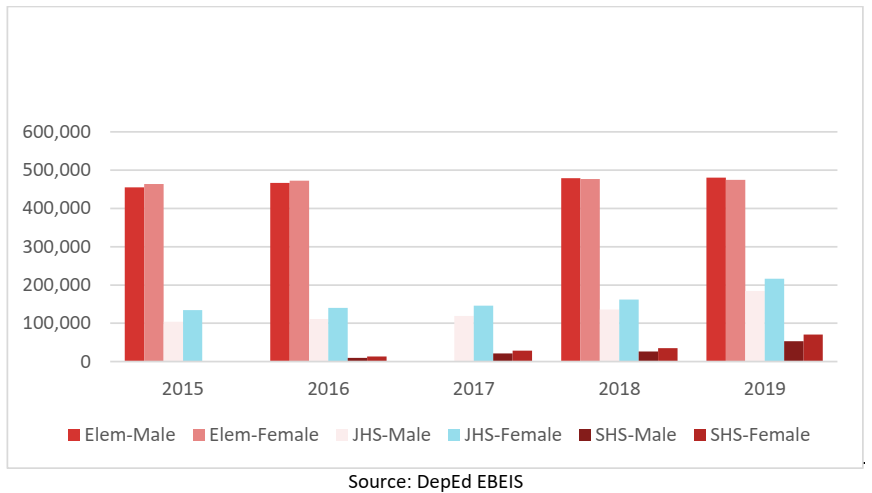
Enrollment of 4Ps Beneficiaries
Figure 11: Enrollment of 4Ps Beneficiaries
Last Mile Schools
The Last Mile Schools is a recent DepEd program that aims to address the gaps in resources and facilities of schools located in geographically isolated, disadvantaged, and conflict-affected areas (GIDCA).
It was initially an initiative to address the infrastructure inequities in education facilities (schools that, until now, are makeshift; schools with less than four classrooms; schools not visited for repairs in the last three years).
However, there was a recognition that these schools are also, most likely, neglected in other aspects. As of December 2019, it was agreed that the LMS is a comprehensive response for schools that do not fall under the usual planning parameters because of certain factors, mostly related to isolation and marginalization.
Most of these schools are in remote areas, conflict-affected areas, or geographically challenging areas. The schools’ communities also tend to lack other basic services.
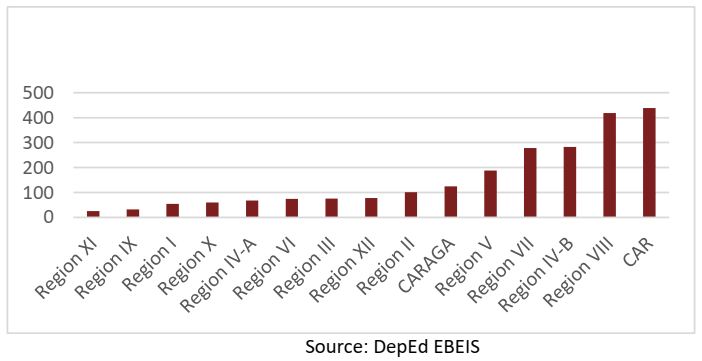
To help address this problem, the Department of Education (DepEd) identified 2,298 Last Mile Schools (LMS) that will focus on significant interventions over the next few years.
These are primarily multi-grade schools in remote locations and do not have enough school-aged population to warrant more educational resources in the past.
CAR, Regions VIII, IV-B, and VII represent 61.71% of identified LMS. These will be provided with new classrooms, more teacher items, a bigger operating budget, and more learning resources and equipment.
According to DepEd Memorandum No. 59, series of 2019, a school must have these characteristics to be eligible as a Last Mile School:
- Have less than four classrooms;
- Have makeshift or nonstandard rooms;
- Absence of electricity;
- Have not been allocated funds for repairs or new construction projects in the last four years;
- With a travel distance of more than one hour from the town center, or with the difficulty of the terrain
- Having multigrade classes/rooms;
- With less than five teachers;
- Having a student population of fewer than 100 learners; and
- With more than 75% of Indigenous People learners
The program will build classrooms, replace makeshift or nonstandard classrooms with standard ones, provide furniture, and install solar panels, water supply, learning materials, and ICT equipment for 2,298 schools.
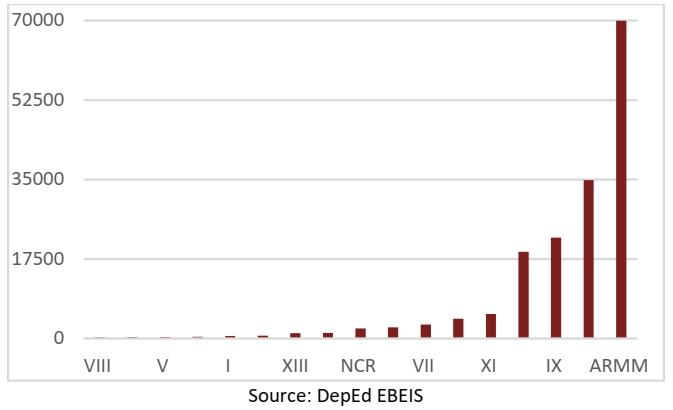
Number of Last Mile Schools
Figure 12: Number of Last Mile Schools
Multigrade Program in the Philippine Education
DepEd launched in 1993 the Multigrade Program in the Philippine Education (MPPE) to improve equitable access to quality elementary education, particularly in isolated and poor communities.
It is anchored on the Basic Education Act of 2013. DepEd has defined standards, mechanisms, and processes in the organization of multigrade classes, adoption of multigrade teaching, the content of the specific curriculum, mode of instruction, provision of education resources, incentives and benefits for teachers, creation of appropriate learning environment, and monitoring and supervision of schools.
The program has a clear orientation to ensure inclusive and equitable quality education for all school-age children. There are multiple challenges as this program works in isolated communities that are difficult to reach and where management and supervision are also difficult.
According to a study conducted by SEAMEO INNOTECH for DepEd and UNICEF, the number of multigrade schools has been declining, from 12 799 in SY 2009-2010 (33.37% of the public elementary schools) to 12,282 in SY 2014-2015 (31.76%), and just 7,234 in SY 2017-2018 (18.6%). The regions with more multigrade schools are Eastern Visayas (19.41%), CAR (9.51%), and Cagayan Valley (7.64%).
The above-mentioned study found that the sampled multigrade schools were compliant “with classroom organization, classroom programs, capacity building, and hiring of teachers and staff movement, and partially compliant with school plant, basic features of the classroom including WinS facilities, teacher incentives, teaching and learning resources, and fund allocation.”
The factors contributing to successful implementation were instructional delivery, traditional assessment, parental and community engagement, teacher motivation and commitment, and school leadership.
According to the study, the main challenges are linked to the multiple roles of the teachers, the difficulties for school heads and supervisors to provide adequate instructional support, and the absence of a responsive M&E system.
LMS, MG, and Hardship Post schools also face the challenge of retaining experienced teachers. Usually, teachers deployed in these areas are recruits from the local population, but once given enough experience, a transfer request is raised, eventually leading to a cycle.
Alternative Delivery Mode
Alternative Delivery Mode (ADM) tried and tested alternative modalities of education delivery within the confines of the formal system that allows schools to deliver quality education to marginalized students and those at risk of dropping out to help them overcome personal, social, and economic constraints in their schooling.
ADM provides formal education options to learners enrolled in formal school but who cannot regularly attend school for several reasons. The target learners are marginalized, children whose parents are constantly moving, sick children, children/youth working in the daytime, late enrollees, and children at risk of dropping out. ADM is implemented in existing K, elementary and secondary schools and uses the same K to12 curriculum.
READ:
Equitable Access to Quality Education in the Philippines
Education Policy Priorities and Reform in the Philippines
Addressing Gaps in DepEd Developed Learning Resources
DepEd Projected Classroom Shortages in Case of Limited to Full Face-to-Face Classes
The Importance of a School-Based Management System (SBM)
Total Number of DepEd Teachers by Position Title and Level of Education
Number of Teachers by Teaching Assignment not in Area of Specialization
The Proportion of Teachers With Teacher III and Master Teacher Positions
Unfilled Positions in DepEd by Regions
Overall Passing Rate in Licensure Examination for Teachers (LET)
Administrative Cases Filed by Private Lending Institutions Against DepEd Personnel
Classroom Shortages in the Philippines
Source:
Office of the Undersecretary for Administration (OUA)