This article shows the effectiveness of the Department of Education (DepEd) in granting equitable access to learners throughout the basic education sector.
Table of Contents
Equitable Access and Participation
DepEd is responsible for delivering basic education through 61,946 schools across the country. Prior to COVID-19 in early 2020, it served nearly 28 million learners.
The number of public schools has been stable over the past decade until the Senior High School Level was implemented in 2016. This resulted in a significant increase in the number of schools offering secondary-level classes and particularly in private schools.
State Universities and Colleges (SUCs), as well as Local Universities and Colleges (LUCs), were tapped to offer Senior High Schools (SHS). The increase in the sector’s size was facilitated by implementing a Voucher Program, which effectively permitted private schools to implement Senior High School and absorb the excess capacity of students from DepEd public schools progressing on to SHS.
The total enrollment in all grades (Kindergarten to Grade 12) in SY 2019-2020 was 27,790,114, including private, public, those in laboratory classes of state universities, and Philippine Schools Overseas serving the children of Filipino overseas workers.
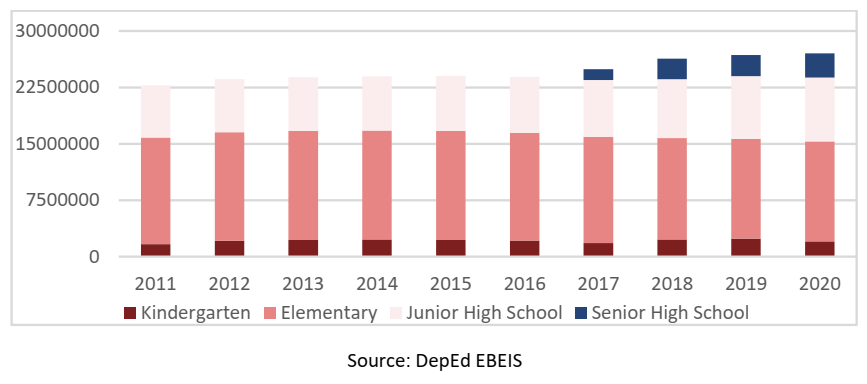
Over the last ten years, the number of learners in Kindergarten-Grade 10 showed a significant increase in JHS, a weak increase in Kindergarten, and a decrease in Elementary (figure 1). There was a continued increase in enrollment for Junior High School (Grades 7-10), signaling the system’s efficiency at keeping students in school and its effectiveness in attracting dropouts and early school leavers back to school. There was a significant increase in total enrollments when SHS was introduced in 2017, with a concentration in urban areas.
Enrollment Trends
Figure 1: Enrollment Trends, 2011-2020
Historical Enrolment by Level of Education (Public and Private Schools)
Table 1: Historical enrolment by level of education (public and private schools), 2016-2020
| Year | Kinder | Elementary (Grade 1-6) | Junior High School (Grade 7-10) | Senior High School (Grade 11-12) | Grand Total | Growth Rate |
|---|---|---|---|---|---|---|
| 2016 | 1,814,713 | 14,100,290 | 7,564,827 | 1,445,107 | 24,924,937 | 4.41% |
| 2017 | 2,268,455 | 13,483,620 | 7,826,414 | 2,733,460 | 26,311,949 | 5.56% |
| 2018 | 2,409,782 | 13,265,259 | 8,320,627 | 3,022,841 | 27,018,509 | 2.63% |
| 2019 | 2,044,745 | 13,287,961 | 8,503,650 | 3,188,334 | 27,030,391 | 0.04% |
| 2020 | 1,806,695 | 11,953,643 | 7,916,655 | 2,891,577 | 24,641,792 | -9% |
Table 1 shows a sustained increase in Kindergarten numbers up to 2016, but then the numbers decreased in 2019 (before COVID-19). There was a considerable decrease of 365,307 students, and most of this reduction occurred in public schools. This change was due, at least partially, to a change in the application of the Kindergarten policy.
In elementary schools, a negative trend started in 2017, with a significant reduction in enrolment of more than 835,000 students, mostly in public schools. Likewise, the increase in enrolment in both JHS and SHS is mainly in public schools, with an impressive increase of 89% in SHS between 2016 and 2017, as it was incorporated as a new free basic education level. The subsequent decrease in enrolment at all levels in 2020 because of the COVID-19 pandemic mainly was in private schools.
National Gross Enrollment Rate (GER) and Net Enrollment Rate (NER)
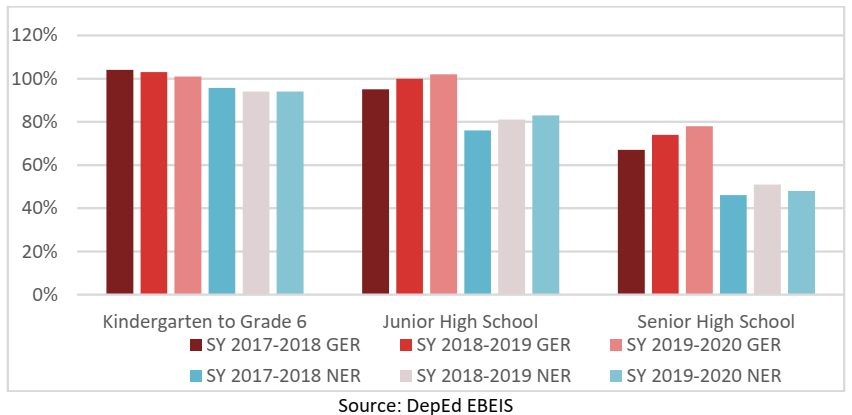
Figure 2: National Gross Enrollment Rate (GER) and Net Enrollment Rate (NER), SY 2017-2018 to 2019-2020
Gross Enrollment Rate and Net Enrollment Rate by Educational Level
Table 2: Gross Enrollment Rate and Net Enrollment Rate by Educational Level, SY 2017-2020
| Level of Education | Gross Enrollment Rate (GER) | Net Enrollment Rate (NER) | ||||
|---|---|---|---|---|---|---|
| SY 2017-2018 | SY 2018-2019 | SY 2019-2020 | SY 2017-2018 | SY 2018-2019 | SY 2019-2020 | |
| Kindergarten | 102% | 107% | 90% | 84% | 76% | 63% |
| Grade 1 to Grade 6 | 105% | 102% | 101% | 94% | 94% | 94% |
| Junior High School | 95% | 100% | 102% | 76% | 81% | 83% |
| Senior High School | 67% | 74% | 78% | 46% | 51% | 48% |
The analysis of enrollment rates shows that the Kindergarten and Elementary sectors experienced a declining trend in recent years. While the GER in Elementary declined four percentage points (p.p.) and the NER remained stable, in Kindergarten, the downward trend was more accentuated, with a reduction of 12 p.p. in GER and 21 p.p. in NER.
Enrollment in secondary education has consistently grown in the last three years. In SHS, the GER rose 11 p.p. in three years, while the NER rose less than two p.p., which indicates that more learners are accessing SHS but not at the right age.
Key Stages in Basic Education
The Enhanced Basic Education Act of 2013 established one year of compulsory Kindergarten for five-year-olds. However, many parents are not sending their 5-year-old children to Kindergarten, and current enrollment rates are lower than the figures obtained when the Act was approved.
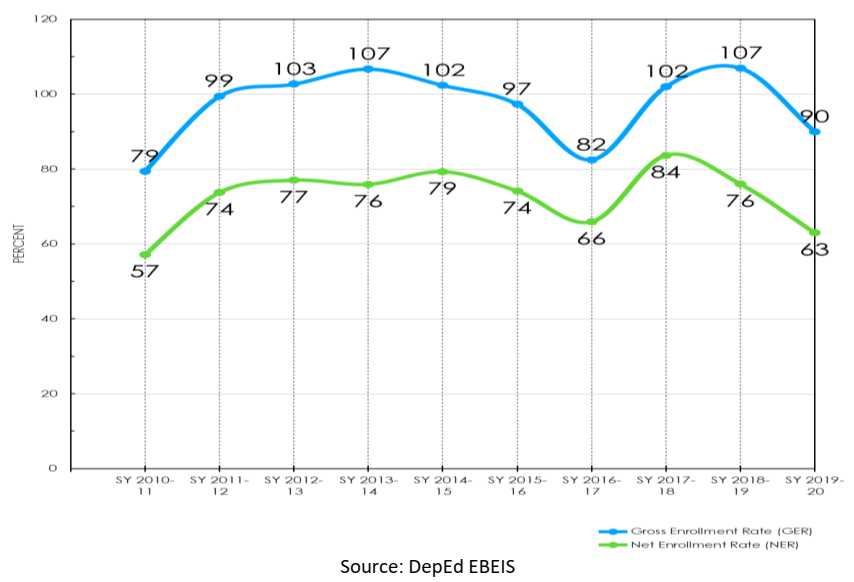
In SY 2012-2013, just before the 2013 Act was implemented, the GER for Kindergarten was 102.7% and the NER 77%. In the following three years, the GER fell by 25 p.p. and the NER by ten p.p. The enrollment has fluctuated dramatically, with a high GER of 107% in SY 20132014 and a low of 82.5% in SY 2016-2017. In SY 2019-2020, the GER was 90% and the NER 63%.
GER and NER existed in parallel except in 2018, when the GER increased from 102% to 107%, while the NER decreased from 84% to 76% (table 1). That means many more children are enrolled in school but are not in the “right-age” group. The difference between GER and NER has been high throughout the years, with the highest difference (31 p.p.) in 2014 and 2018.
The Kindergarten NER reflects the changes in the policy for eligible ages that can be enrolled in the level. In 2015, DepEd accepted children who will turn five years old by June 1 but gave some allowance until October 31.
However, in 2016, this policy was drastically changed, and the cut-off became August 31, helping to explain the drop of the indicator from 74% to 66%.
In 2017, the policy was retained, and many of those children who were ineligible to enroll in 2016 were accepted in 2017, resulting in a significant increase in the indicator from 66% to 84%.
In 2018, a new policy set the age cut-off to June 1, driving the indicator downward. However, there was public pushback on this policy, and DepEd amended it to account for different starting months for private schools (i.e., some start in June, others in July, and the rest in August). So there was a more lenient implementation of the June cut-off.
The net effect of this policy adjustment was a decline in the indicator, but not as large had the June cut-off been observed. In 2019, the June cut-off was finally enforced, and the indicator decreased to 63%, as had occurred in 2016 when a similar policy was implemented.
The net enrollment rate in Kindergarten in SY 2019-2020 is only 63.43%. Despite the law-making Kindergarten mandatory at age 5, many parents still believe that their children are too young to attend formal school.
Other reasons for non-enrolment are poverty, parents having to work, and no one to assist the child in attending school. The FLEMMS 2019 survey also corroborated this data by asserting that 98% of children aged 3-4 are reportedly not attending school because they are too young.
Gross Enrollment Rates and Net Enrollment Rates in Kindergarten
Figure 3: Gross Enrollment Rates and Net Enrollment Rates in Kindergarten, SY 2010-2011 to SY 2019-2020.
Another reason for the low enrollment rates in Kindergarten can be found in the participation rates in early learning programs for 3- and 4-year-olds, which remain relatively low despite national and local efforts to provide early learning opportunities in center-based, home-based, or mobile early learning services.
According to household survey data, only around 30% of 3-4-year-old children participated in preschool programs in 2015. According to DSWD’s administrative data on supplementary feeding programs, about 1.78 million children were enrolled in daycare centers in 2018, representing only about 40% of 3-4-year-old children. There is a need to collect data on why so many three and 4-year-olds are not benefiting from early learning programs, despite the policy framework in the Early Years Act of 2013.
Implementing the Early Years Act, emphasizing the holistic development of a child and the cross-sectoral nature of the service, still faces multiple challenges. These include
- malnutrition,
- neonatal mortality,
- challenges in cognitive and socio-emotional outcomes of young children from disadvantaged households,
- challenges with developmental outcomes of young children with disabilities and young children with developmental delays, and
- violence experienced by young children in their homes.
In a broader context, ECCD continues to face issues with (1) service delivery, (2) data collection and use, (3) institutional organization, and (4) legislative framework.
There are also disparities in the access of 3-5-year-old children to ECCD services for the following groups: children with disabilities, children with developmental delays, children whose parents are subsistence farmers and fisher folks, children living in indigenous communities (especially those that are mobile and migratory), children living in geographically isolated and disadvantaged areas, children living in conflict areas, children living in disaster-affected areas, children living in poor urban areas, children living on the streets.
The NER for Elementary shows DepEd’s ability to bring children into school at the right age (between 6 and 12 years old). In the last two years, NER has been around 95%, which means that 5% of elementary school-age children are not in school.
Gross Enrollment Rates and Net Enrollment Rates for Elementary
Figure 4: Gross Enrollment Rates and Net Enrollment Rates for Elementary, SY 2009-2010 to SY 2019-2020
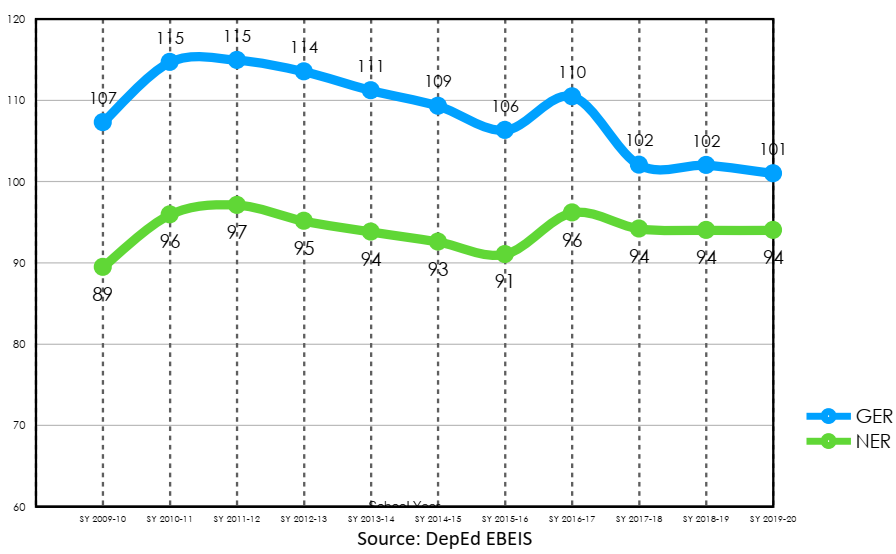
GER and NER have changed from a difference of 18 p.p. in 2009 to 8 p.p. in 2020, which means that more children are in school at the right age. However, the current NER is lower than ten years ago, which indicates that more families are not sending their children to elementary education because of a perception that what is taught in school is not relevant or not interesting for children, or there is a growing opportunity cost of enrolling children in school. According to FLEMMS, lack of personal interest, disability, and insufficient family income are also reasons for children not attending elementary school.
Elementary NER experienced a 2-p.p. drop in SY2017-2018 due to the significant drop in Kindergarten NER in SY2016-2017. While the drop in Kindergarten NER the previous year was around eight p.p., elementary education covers a bigger age group (6-11 years); thus, the drop in Elementary NER was significantly smaller. After this statistical correction, the Elementary NER stabilized again.
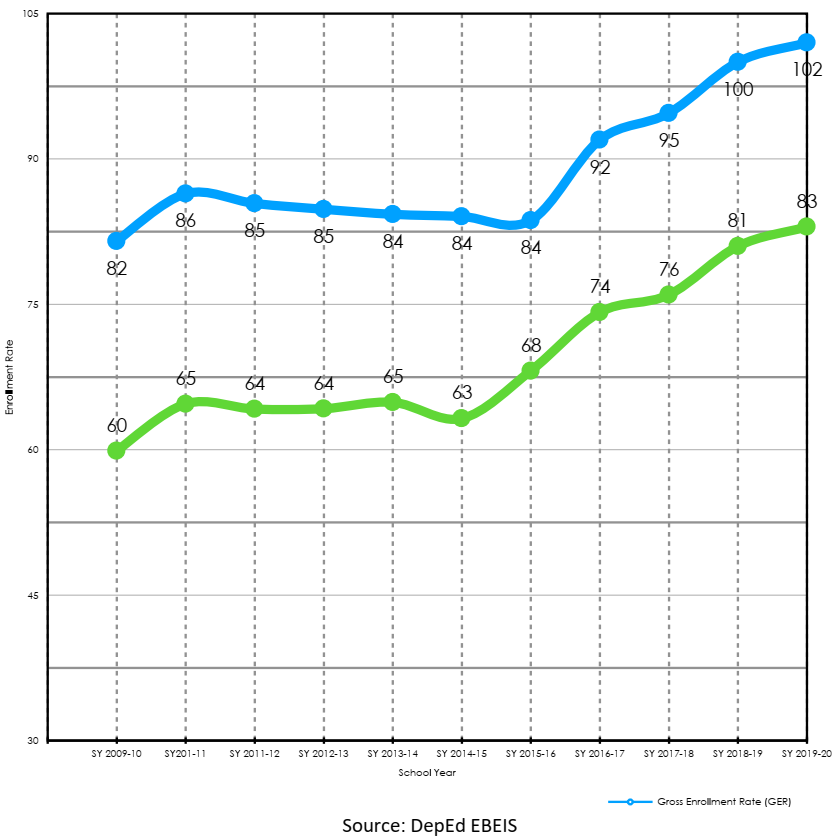
In JHS, after five years of stagnation between 2010 and 2015, GER and NER have been consistently growing in parallel in recent years, with a GER of 102% and a NER of 83% in SY 2019-2020. The variation in NER for JHS between boys and girls is 8.4 p.p.
Gross Enrollment Rates and Net Enrollment Rates for Junior High School
Figure 5: Gross Enrollment Rates and Net Enrollment Rates for Junior High School, SY 2019-2020
By SY 2019-2020, there were 18,306 SHS nationwide, serving almost 3.2 million SHS students. These figures have consistently grown since 2016, which points to society’s gradual acceptance of SHS’s importance.
A significant reason for this increased number is due to the vouchers provided by DepEd to SHS students in private schools: 1,290,184 students from private SHS and 58,808 learners from non-DepEd public SHS, according to the DepEd’s budget report.
Senior High School (SHS) Schools and Students per Track
Table 3: Senior High School (SHS) Schools and Students per Track, SY 2019-2020
| Senior High School Tracks | No. of Schools | No. of Students |
|---|---|---|
| Academic | 10,581 | 2,091,477 |
| Technical Vocational Learning | 7,358 | 1,082,531 |
| Sports | 120 | 5,483 |
| Arts & Design | 247 | 14,544 |
| Total | 18,036 | 3,194,035 |
The same data show that the Academic track emerged as the preferred track for 65% of SHS students. This represents studies on (1) Accountancy, Business and Management, (2) Humanities and Social Sciences, (3) Science, Technology, Engineering and Mathematics (STEM), (4) General Academic Studies and (5) Maritime Education.
The Technical-Vocational Learning track attracted 34% of SHS students and is closely linked with TESDA courses and certification. Around 93% of students in this track gain National Certificate I and II credentials by the time they graduate. The remaining students are in specialized programs in Sports and Arts & Design.
Gross Enrollment Rates and Net Enrollment Rates for Senior High School
Figure 6: Gross Enrollment Rates and Net Enrollment Rates for Senior High School, SY 2016-2020
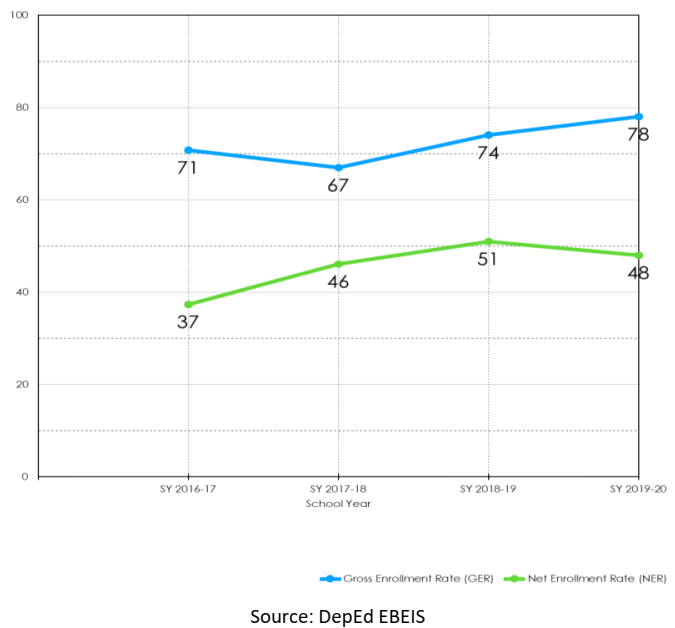
The Philippine Institute for Development Studies (PIDS) found that the SHS program had notable gains because all stakeholders gave it a chance and exerted effort to make it successful.
Unfortunately, these figures only translate to 78% GER and 48% NER for the entire level. These figures continue to reflect the high opportunity costs of education, especially for students in the higher grades.
Moreover, the program still must address the following challenges: (1) lack of resources, (2) curriculum issues, (3) inadequate social marketing, (4) lack of capacity building for teachers, (5) unavailability of all tracks in all geographic areas, (6) uneven implementation nationwide, (7) lack of subsidies for taking National Certificate examinations, (8) inadequate human resources and (9) lack of coordination with external partners, including the long-term plan for the support for private schools.
The continued increases in SHS GER, even during a period when the corresponding NER is declining, can be partially explained by increased employment prospects after graduation.
However, as most SHS enrolment is in the Academic Track, one cannot discount the Universal Access to Quality Tertiary Education Act’s effect on basic education. The law made TVET and college virtually free in public institutions and provided substantial financial assistance for individuals wanting to gain TVET or college credentials in private institutions. The law was passed in 2017 and took effect in SY2018-19, coinciding with the increases in SHS GER while the NER was plateauing and eventually decreasing.
DepEd’s internal monitoring points to increasing acceptance of SHS by the general public and the willingness of the industry to hire SHS graduates. The main driver of this improved reputation is the work immersion program included in the SHS curriculum.
However, many stakeholders have expressed concern that the time allotment for work immersion is only enough for orientation/familiarization and not for actual skills acquisition.
Business groups such as the Philippine Chamber of Commerce and Industry have been lobbying DepEd for increased work immersion hours to improve students’ employability immediately after completing SHS.
The generally positive response to SHS should also be viewed concerning the labor surplus when considering college students and graduates looking for work. It is crucial to ensure that SHS graduates will be competitive in a labor market in surplus.
Regional Characteristics
For SY 2019-20 (before COVID-19), Region IV-A had the most significant share of total enrollment, while CAR had the lowest. The enrolment size reflects the distribution of population in the country, as well as the economic activity in the regions.
National average data mask disparities between and within different regions. The national NER in Kindergarten is 63.43%, but there are regions with less than 60% of NER (BARMM, NCR, Region I, and Region IV-B). In comparison, other regions have a NER near or above 70% (Region X and Region VII).
Net Enrollment Rate for All Basic Educational Levels by Region
Table 3: Net Enrollment Rate for All Basic Educational Levels by Region, SY 2019-2020
| Region | Kindergarten | Grades 1 to 6 | Kindergarten to Grade 6 | Grades 7 to 10 (JHS) | Grades 11 to 12 (SHS) | Grades 7 to 12 (JHS to SHS) |
|---|---|---|---|---|---|---|
| Region I – llocos Region | 57.10% | 89.99% | 88.66% | 89.85% | 61.54% | 90.38% |
| Region II – Cagayan Valley | 62.45% | 97.17% | 95.71% | 88.81% | 56.46% | 88.63% |
| Region III – Central Luzon | 67.06% | 100.03% | 100.00% | 87.69% | 58.03% | 87.69% |
| Region IV-A (CALABARZON) | 65.37% | 98.23% | 98.22% | 87.85% | 54.79% | 87.96% |
| Region IV-B (MIMAROPA) | 58.61% | 90.26% | 89.57% | 81.12% | 46.00% | 81.65% |
| Region V – Bicol Region | 63.58% | 92.68% | 92.73% | 82.27% | 42.31% | 82.65% |
| Region VI – Western Visayas | 66.82% | 97.25% | 96.39% | 85.68% | 44.22% | 85.89% |
| Region VII – Central Visayas | 69.50% | 98.07% | 97.97% | 88.52% | 47.81% | 88.42% |
| Region VIII – Eastern Visayas | 61.75% | 91.60% | 91.15% | 80.05% | 42.08% | 80.09% |
| Region IX – Zamboanga Peninsula | 65.24% | 91.70% | 92.91% | 74.24% | 34.43% | 75.03% |
| Region X – Northern Mindanao | 73.36% | 99.23% | 100.57% | 76.75% | 38.05% | 77.01% |
| Region XI – Davao Region | 60.45% | 93.87% | 93.58% | 85.44% | 41.53% | 84.94% |
| Region XII – SOCCSKSARGEN | 64.41% | 92.24% | 92.57% | 75.89% | 37.45% | 76.46% |
| CARAGA Region | 64.31% | 94.84% | 94.38% | 82.20% | 40.77% | 81.80% |
| BARMM – Bangsamoro Autonomous Region in Muslim Mindanao | 53.65% | 71.51% | 75.84% | 36.48% | 10.59% | 38.41% |
| CAR – Cordillera Administrative Region | 62.32% | 91.40% | 89.91% | 84.76% | 50.53% | 84.26% |
| NCR – National Capital Region | 57.17% | 89.91% | 88.88% | 89.68% | 62.28% | 91.54% |
| TOTAL | 63.43% | 93.96% | 93.87% | 82.89% | 47.76% | 83.27% |
In Elementary education, while Region III achieved a NER of 100%, nine regions were below the average NER of 94%, with BARMM reaching only a NER of 71.5%.
The Philippines has an average NER of 83% in JHS; Region I and NCR have the highest rates (above 89%); Region IX, Region X, and Region XII are below 77%, and BARMM has only 36.5%. The NER falls to 48% in SHS, with significant disparities among the regions: Those regions with a higher proportion of urban populations show the highest NER in NCR and Region I, around 62%, Region III and IV near 55%. On the other hand, the NER in Regions IX, X, and XII are below 40%, and BARMM has a meager 10.6%.
Further analysis of the factors driving the results in the successful regions can help to improve the performance of those less successful regions. For example, Region III and NCR are quite successful, except for Kindergarten in NCR. Region I is a paradoxical case as it is at the bottom of the listing for NER in Kindergarten and Elementary but near the top for JHS and SHS, which may reflect the priorities of the regional authorities.
Region 9 and BARMM could benefit significantly from more detailed analyses of the situation in regions with better enrolment indicators. Particular attention should be given to BARMM, as its indicators are not just consistently the lowest (with a higher difference of 46 p.p. less than the national average in NER in JHS) but are also considered outliers because of its very low magnitudes. This is consistent with the findings that the highest drop-out rates and the number of out-of-school children and youth are in BARMM.
Top and Bottom Regions for Net Enrollment Rates (NER)
Table 4: Top and Bottom Regions for NER, SY 2019-2020
| Kindergarten | Elementary | JHS | SHS | ||||
|---|---|---|---|---|---|---|---|
| Top | Bottom | Top | Bottom | Top | Bottom | Top | Bottom |
| Region X 73.36% | BARMM 53.65% | Region III 100.03% | BARMM 71.51% | Region I 89.85% | BARMM 36.48% | NCR 62.28% | Region V 42.31% |
| Region VII 69.50% | Region I 57.10% | Region X 99.23% | Region I 89.99% | NCR 89.68% | Region IX 74.24% | Region I 61.54% | Region IX 34.43% |
| Region III 67.06% | NCR 57.17% | Region IV-A 98.23% | Region IV-B 90.26% | Region II 88.81% | Region XII 75.89% | Region III 58.03% | BARMM 10.59% |
| Region VII 98.07% | Region VII 88.52% |
The disparities are not only among regions but also within regions, when NER is disaggregated by gender. The differences between the numbers of elementary girls and boys when disaggregated by region go from less than 5 p.p. in Region I to around 10 p.p. in Regions II, VII, IX, XI and BARMM.
The national NER in SHS in SY 2019-2020 is 48%, but the disaggregated data show that the disparities between males and females are significant. For instance, there is a gap of almost 15 p.p. in favor of girls (NER is 40.65% for boys; 55.34% for girls). When the NER is disaggregated by region (table 12), the difference is above 13 p.p. in almost all the regions. In CAR, the gap is almost 19 p.p. (41.46% for boys and 60.28% for girls). In BARMM, the difference is just 6 p.p. but the NER is extremely low for both boys (7.49%) and girls (13.73%).
Net Enrollment Rate per Key Stage by Region and Gender
Table 5: Net Enrollment Rate per Key Stage by Region and Gender (SY 2019-2020)
| Region | Kindergarten | Grades 1 to 6 | Junior High School (Grades 7-10) | Senior High School (Grades 11-12) | |
|---|---|---|---|---|---|
| Region I – Ilocos | Total (MF) | 57.10% | 89.99% | 89.85% | 61.54% |
| Male (M) | 57.08% | 90.35% | 87.06% | 54.50% | |
| Female (F) | 57.13% | 89.61% | 92.83% | 69.23% | |
| Region II – Cagayan Valley | Total (MF) | 62.45% | 97.17% | 88.81% | 56.46% |
| Male (M) | 62.67% | 97.31% | 84.75% | 48.45% | |
| Female (F) | 62.21% | 97.02% | 93.13% | 65.20% | |
| Region III – Central Luzon | Total (MF) | 67.06% | 100.03% | 87.69% | 58.03% |
| Male (M) | 66.76% | 100.02% | 84.04% | 51.62% | |
| Female (F) | 67.38% | 100.03% | 91.57% | 64.94% | |
| Region IV-A (CALABARZON) | Total (MF) | 65.37% | 98.23% | 87.85% | 54.79% |
| Male (M) | 64.27% | 97.87% | 84.29% | 48.16% | |
| Female (F) | 66.53% | 98.61% | 91.62% | 61.84% | |
| Region IV-B (MIMAROPA) | Total (MF) | 58.61% | 90.26% | 81.12% | 46.00% |
| Male (M) | 57.95% | 89.79% | 77.19% | 39.02% | |
| Female (F) | 59.31% | 90.75% | 85.31% | 53.52% | |
| Region V – Bicol | Total (MF) | 63.58% | 92.68% | 82.27% | 42.31% |
| Male (M) | 62.91% | 93.09% | 78.18% | 34.35% | |
| Female (F) | 64.28% | 92.25% | 86.59% | 50.91% | |
| Region VI – Western Visayas | Total (MF) | 66.82% | 97.25% | 85.68% | 44.22% |
| Male (M) | 66.78% | 97.74% | 81.63% | 36.34% | |
| Female (F) | 66.87% | 96.75% | 89.96% | 52.66% | |
| Region VII – Central Visayas | Total (MF) | 69.50% | 98.07% | 88.52% | 47.81% |
| Male (M) | 68.85% | 98.08% | 83.37% | 39.12% | |
| Female (F) | 70.18% | 98.05% | 93.97% | 57.12% | |
| Region VIII – Eastern Visayas | Total (MF) | 61.75% | 91.60% | 80.05% | 42.08% |
| Male (M) | 61.20% | 91.44% | 75.50% | 33.84% | |
| Female (F) | 62.33% | 91.76% | 84.85% | 50.92% | |
| Region IX – Zamboanga Peninsula | Total (MF) | 65.24% | 91.70% | 74.24% | 34.43% |
| Male (M) | 63.92% | 91.22% | 69.13% | 27.06% | |
| Female (F) | 66.63% | 92.20% | 79.54% | 42.28% | |
| Region X – Northern Mindanao | Total (MF) | 73.36% | 99.23% | 76.75% | 38.05% |
| Male (M) | 72.73% | 100.10% | 72.47% | 31.02% | |
| Female (F) | 74.02% | 98.33% | 81.13% | 45.48% | |
| Region XI – Davao | Total (MF) | 60.45% | 93.87% | 85.44% | 41.53% |
| Male (M) | 59.19% | 93.15% | 80.15% | 33.81% | |
| Female (F) | 61.79% | 94.63% | 90.98% | 49.67% | |
| Region XII – SOCCSKSARGEN | Total (MF) | 64.41% | 92.24% | 75.89% | 37.45% |
| Male (M) | 63.17% | 91.82% | 70.70% | 30.88% | |
| Female (F) | 65.72% | 92.68% | 81.29% | 44.41% | |
| CARAGA Region | Total (MF) | 64.31% | 94.84% | 82.20% | 40.77% |
| Male (M) | 64.30% | 95.46% | 78.54% | 34.27% | |
| Female (F) | 64.31% | 94.20% | 85.99% | 47.70% | |
| BARMM – Bangsamoro Autonomous Region in Muslim Mindanao | Total (MF) | 53.65% | 71.51% | 36.48% | 10.59% |
| Male (M) | 49.38% | 68.42% | 31.07% | 7.49% | |
| Female (F) | 58.16% | 74.70% | 41.96% | 13.73% | |
| CAR – Cordillera Administrative Region | Total (MF) | 62.32% | 91.40% | 84.76% | 50.53% |
| Male (M) | 62.78% | 92.25% | 80.81% | 41.46% | |
| Female (F) | 61.83% | 90.51% | 88.90% | 60.28% | |
| NCR – National Capital Region | Total (MF) | 57.17% | 89.91% | 89.68% | 62.28% |
| Male (M) | 56.11% | 89.43% | 86.06% | 54.93% | |
| Female (F) | 58.28% | 90.42% | 93.47% | 70.00% | |
| TOTAL PHILIPPINES | Total (MF) | 63.43% | 93.96% | 82.89% | 47.76% |
| Male (M) | 62.59% | 93.79% | 78.80% | 40.65% | |
| Female (F) | 64.31% | 94.15% | 87.20% | 55.34% |
Transition rates are high in basic education. The transition rate from Grade 4 to Grade 5 was 99% in SY 2019-2020, and for Grade 6 to Grade 7, it was 95.5% (94% for boys and 97% for girls). It is high in all regions except in BARMM, which is 80%. The transition from JHS to SHS is very high, at 97%, with almost parity for numbers of males and females. Most regions have transition rates above 94%, except Regions IV-A and IV-B, 92%, and BARMM, with 85%.
Internal Efficiency
The internal efficiency of an education system is measured through the Cohort Survival Rate (CSR) and Completion Rate (CR). CSR indicates the percentage of pupils or students in a given cohort who started Grade 1 or Grade 7 and reached Grade 6 and 10, respectively. Indicators on school leavers, dropouts, and repetition may help explain CSR and CR. It must be noted that in the Philippines, there is only information on internal efficiency indicators for the formal basic education levels, not for non-formal education.
Cohort Survival Rate and Completion Rate
Table 6: Cohort Survival Rate and Completion Rate – SY 2009 to SY 2019
| School Year | Cohort Survival Rate (%) | Completion Rate (%) | ||
|---|---|---|---|---|
| Elementary | JHS | Elementary | JHS | |
| SY 2009-2010 | 74 | 78 | 72 | 74 |
| SY 2010-2011 | 74 | 79 | 72 | 75 |
| SY 2011-2012 | 74 | 79 | 71 | 74 |
| SY 2012-2013 | 74 | 78 | 73 | 75 |
| SY 2013-2014 | 79 | 79 | 78 | 76 |
| SY 2014-2015 | 85 | 81 | 84 | 78 |
| SY 2015-2016 | 88 | 82 | 84 | 74 |
| SY 2016-2017 | 94 | 83 | 93 | 81 |
| SY 2017-2018 | 94 | 86 | 92 | 84 |
| SY 2018-2019 | 97 | 89 | 97 | 89 |
| SY 2019-2020 | 97 | 87 | 97 | 86 |
CSR and CR reflect the success rates for DepEd to encourage learners to remain in the education system and complete their education. With a 97% CSR and 97% CR rate at the elementary level, almost all pupils who started Grade 1 reach Grade 6 and complete the elementary schooling requirements.
Table 6 shows significant improvements in DepEd’s ability to retain children in school in the last ten years. Improvements in learning facilities and implementation of retention programs in Grades 1-3 may have contributed to the increase in CSR and CR. Retention programs addressing pupils at risk of dropping out (PARDO) are working, as evidenced by a significant reduction in the dropout rate from 6.3% (SY 2009-2010) to 0.6% (SY 2019-2020) and a 99% transition rate (SY 20192020) primary to intermediate level.
Other significant programs, including alternative delivery mode (ADM), mother-tongue-based multi-lingual education (MTB-MLE), and inclusion programs (targeting learners with disability and pupils belonging to disadvantaged communities or sectors), are contributory to the strong retention performance of schools in the elementary level.
Moving forward, elementary schools must continue addressing dropout issues at the primary level. Around 75% of dropouts in SY 2018-2019 and 2019-2020 are between Kindergarten and Grade 4, with Kindergarten and Grade 1 accounting for almost 60% of the dropouts at the primary level. The readiness of kindergarten learners for elementary schooling and their reading competencies should be strengthened and prioritized.
While the ability to retain students in school at the secondary level is improving, it still needs major improvements. The CSR in JHS improved from 78% (SY 2009–2010) to 87% (SY 2019–2020), and the completion rate jumped from 74% CR to 86% CR. Recent data on dropouts are highest in JHS. Figure 7 shows the highest dropout rates in Grades 7-9. The total number of dropouts for Grades 7-9 constitutes 45% of the total number of pupils and students who dropped out of schooling in SY 2019-2020.
Dropouts – Kindergarten to Grade 12
Figure 7: Dropouts – Kindergarten to Grade 12, SY 2019-2020
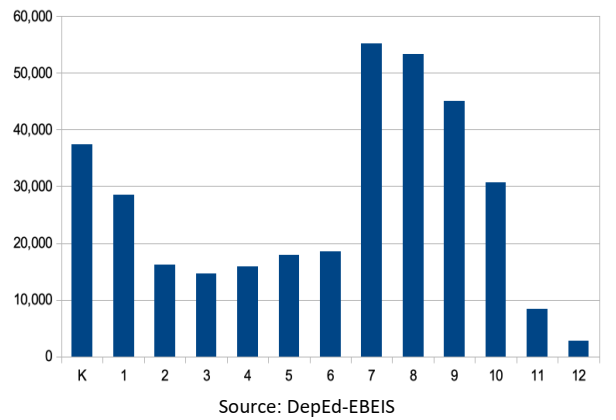
Despite having a 96% transition rate (Grade 6 graduates proceeding to Grade 7), the high number of school leavers and dropouts affected the overall efficiency of schools in JHS.
Retention programs should be reviewed and enhanced, including the dropout reduction program (DORP), open high school (OHS), and other similar programs. Incidences of secondary-level students who cannot read or are at a frustration level should also be addressed and reviewed.
CSR and CR are also low in SHS. SHS dropouts account for only 2% of the total dropouts in the Secondary level. However, these data need to be reviewed and triangulated with NER, CSR, and CR.
For SY 2019-2020, the transition rate is 97%, CSR is 80%, and NER is 48%. The low incidence of dropouts in SHS can be traced to shifting tracks. Students shifting track means changing strand/track within an SY (SHS is divided into two semesters).
Possible causes of shifting track include (i) changing interests, (ii) difficulty coping with requirements, (iii) poor implementation of the track, and (iv) others. The student shifting strand/track did not necessarily drop out and stayed in school. This phenomenon, however, will significantly reduce NER and CSR.
Dropouts in SHS can also be explained by the prospects of landing a job, which is high for SHS students in the TVL track. Regions with vibrant service and manufacturing industries (NCR, Region 3, Region 4A, Region 7, Region 9, and Region 11) may be “pulling” SHS students from SHS schooling.
Dropouts are also observed for SHS students availing of the voucher program. Coping in a private school setting may be difficult for some SHS students from public schools.
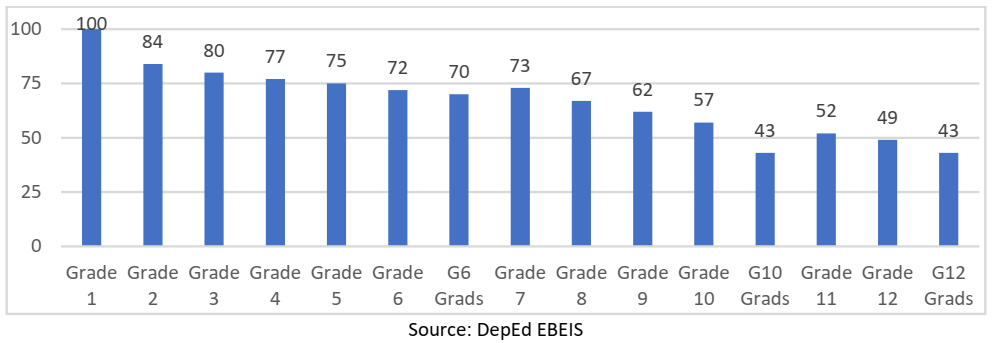
When a cohort from Grade 1 to Grade 12 is followed, the completion rate is low, with only 43% of Grade 1 cohorts completing Grade 12. The most significant attrition may be happening in the JHS, possibly pointing to quality or performance issues of students.
Only 4 out of 10 students graduate from SHS, which may reflect ineffective back-to-school programs or possibly the changing societal mindsets about the long-term benefits of education. Improving the completion rate is a fundamental challenge for DepEd and society in general.
Cohort Survival of Grade 1 Students in SY 2006-2007 to Grade 12 Graduates
Figure 8: Cohort Survival of Grade 1 Students in SY 2006-2007 to Grade 12 Graduates in SY 2017-2018
READ:
The Education Situation of Vulnerable Groups in the Philippines
Education Policy Priorities and Reform in the Philippines
Addressing Gaps in DepEd Developed Learning Resources
DepEd Projected Classroom Shortages in Case of Limited to Full Face-to-Face Classes
The Importance of a School-Based Management System (SBM)
Total Number of DepEd Teachers by Position Title and Level of Education
Number of Teachers by Teaching Assignment not in Area of Specialization
The Proportion of Teachers With Teacher III and Master Teacher Positions
Unfilled Positions in DepEd by Regions
Overall Passing Rate in Licensure Examination for Teachers (LET)
Administrative Cases Filed by Private Lending Institutions Against DepEd Personnel
Classroom Shortages in the Philippines
Source:
Office of the Undersecretary for Administration (OUA)